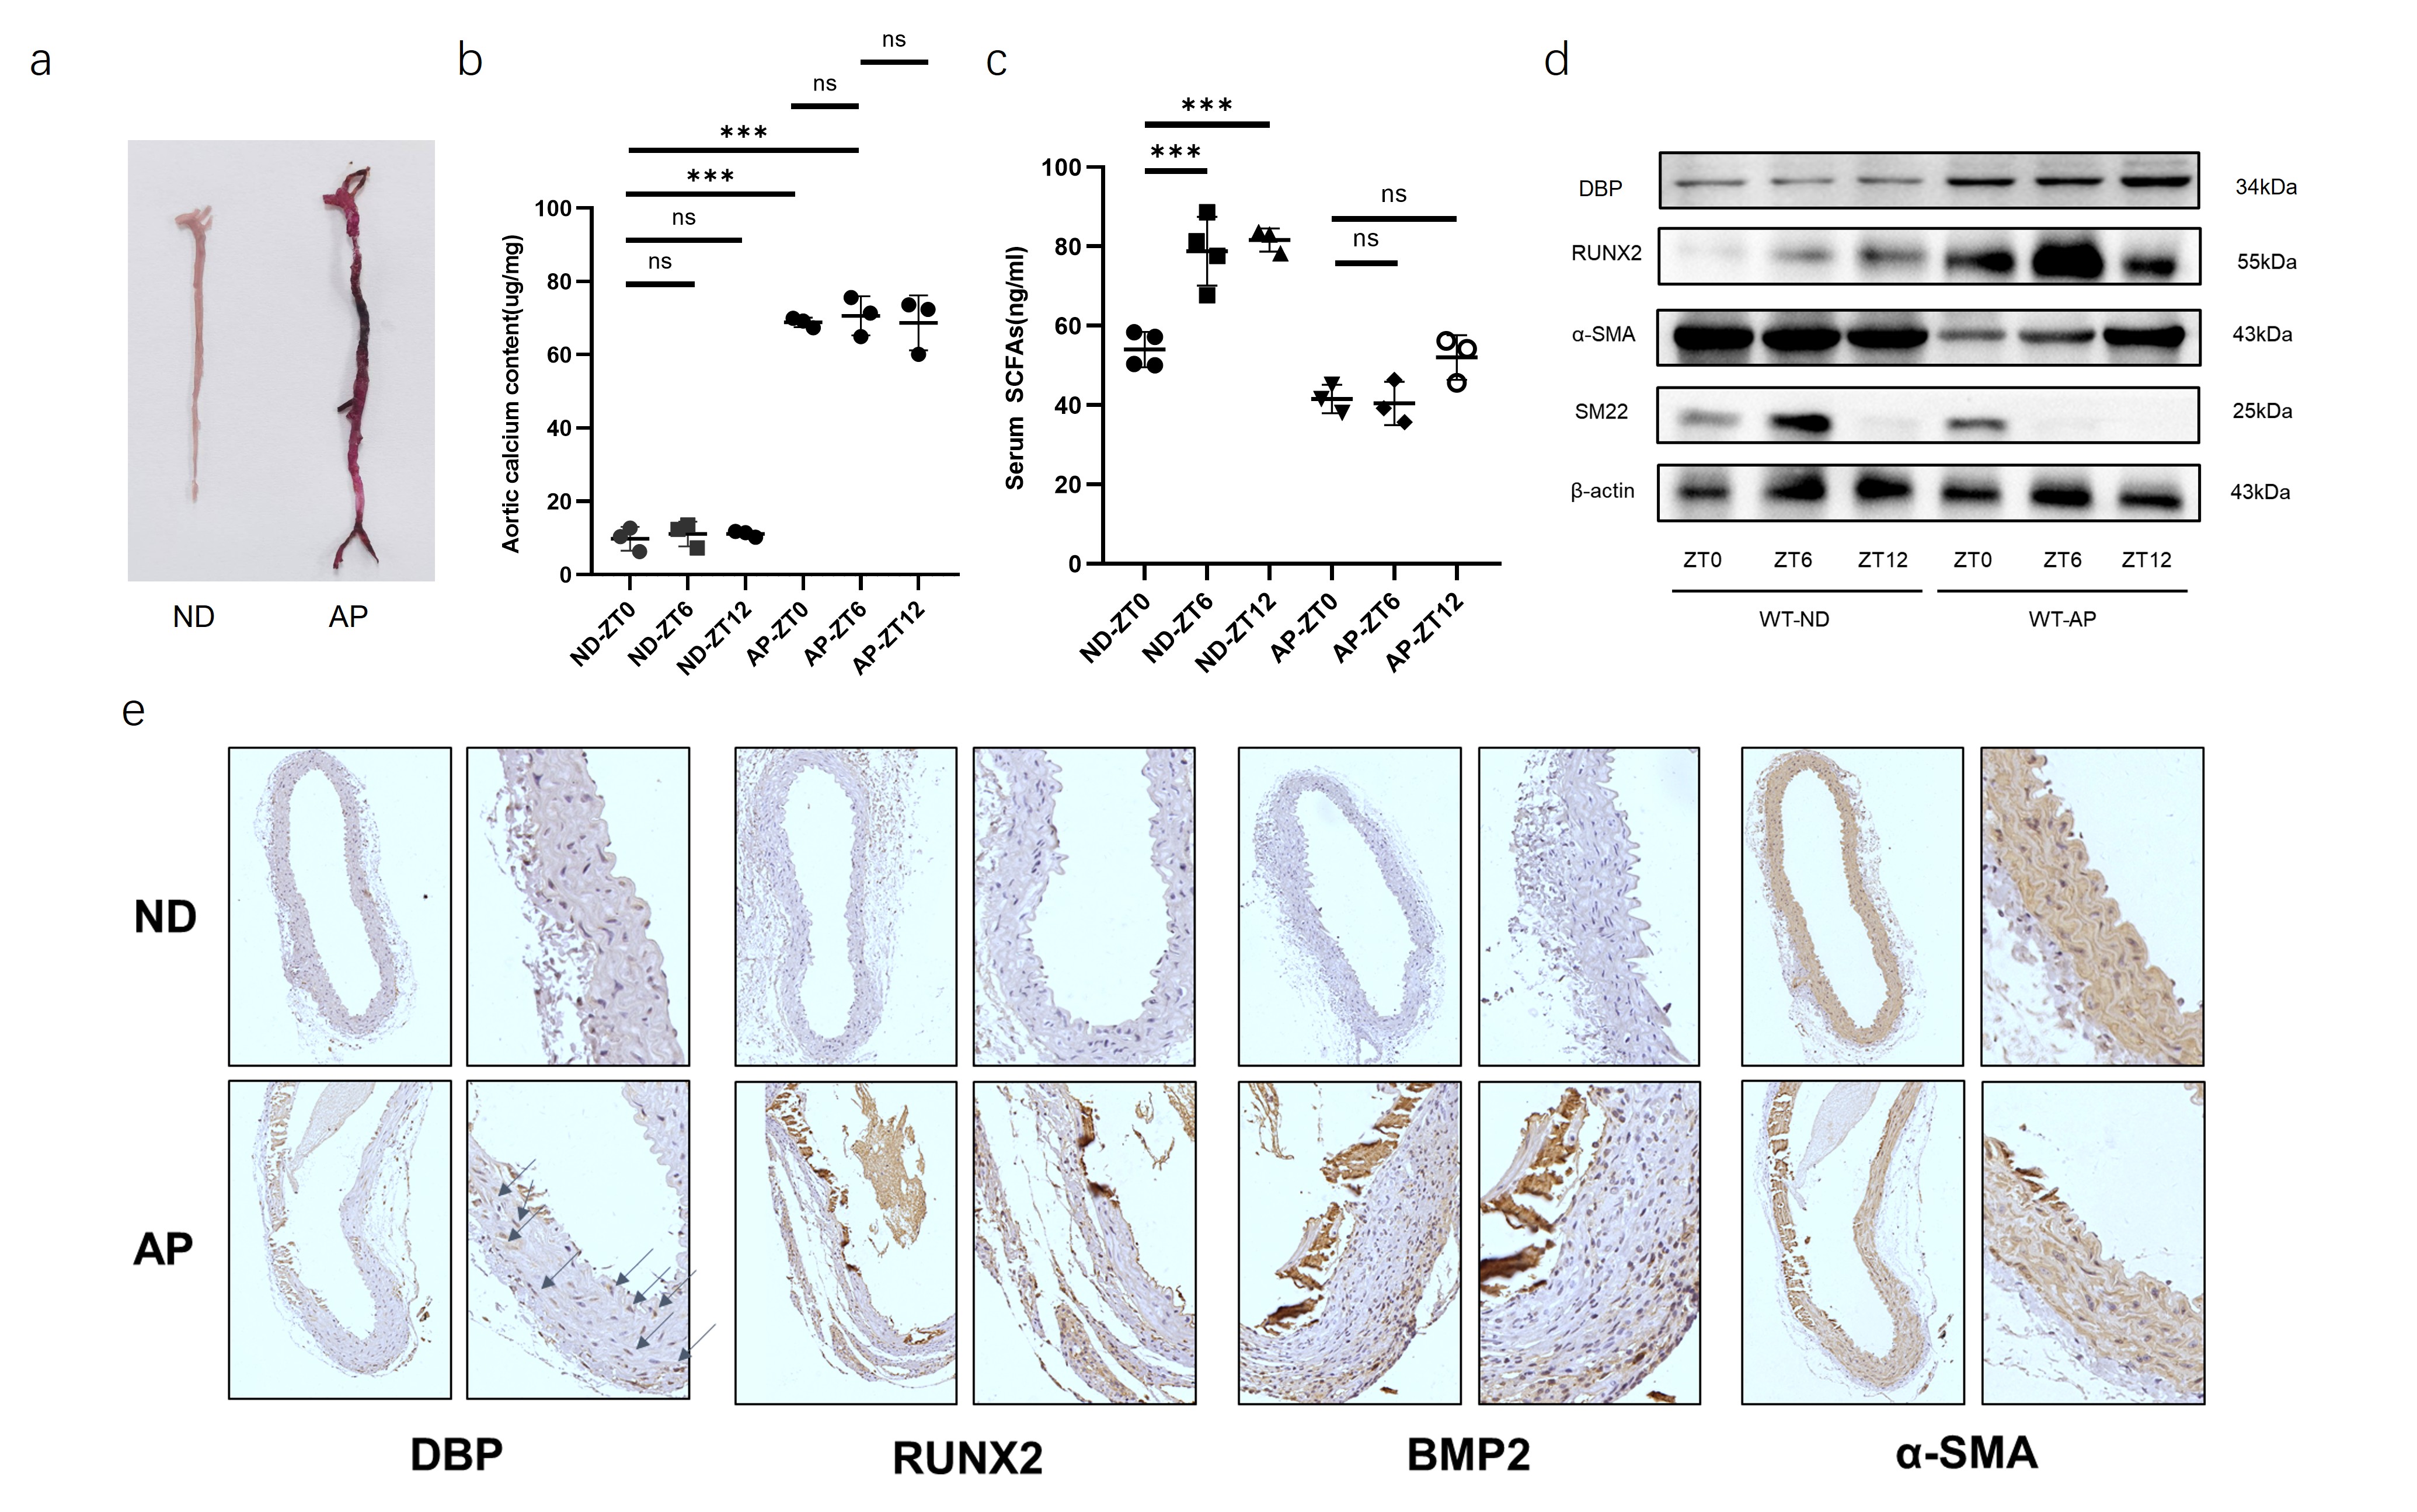
Alizarin
red staining showed severe aortic calcification in the CKD vascular
calcification model group (Figure 1a); calcium ion content in the vascular
tissues of the calcification group was significantly increased (Figure 1b),
while serum SCFAs levels were significantly decreased (Figure 1c). Western blot
analysis of calcification-related protein expression levels in vascular tissues
revealed that, compared to the control group, the expression of the
calcification marker OPN was significantly upregulated, and the vascular smooth
muscle marker α-SMA was significantly downregulated in CKD calcification mice (Figure 1d).
Meanwhile, DBP expression levels were significantly upregulated in the vascular
tissues of CKD calcification mice (Figure 1d-e). Immunohistochemistry results showed
significant increases in the calcification markers RUNX2 and BMP2 (Figure 1e).
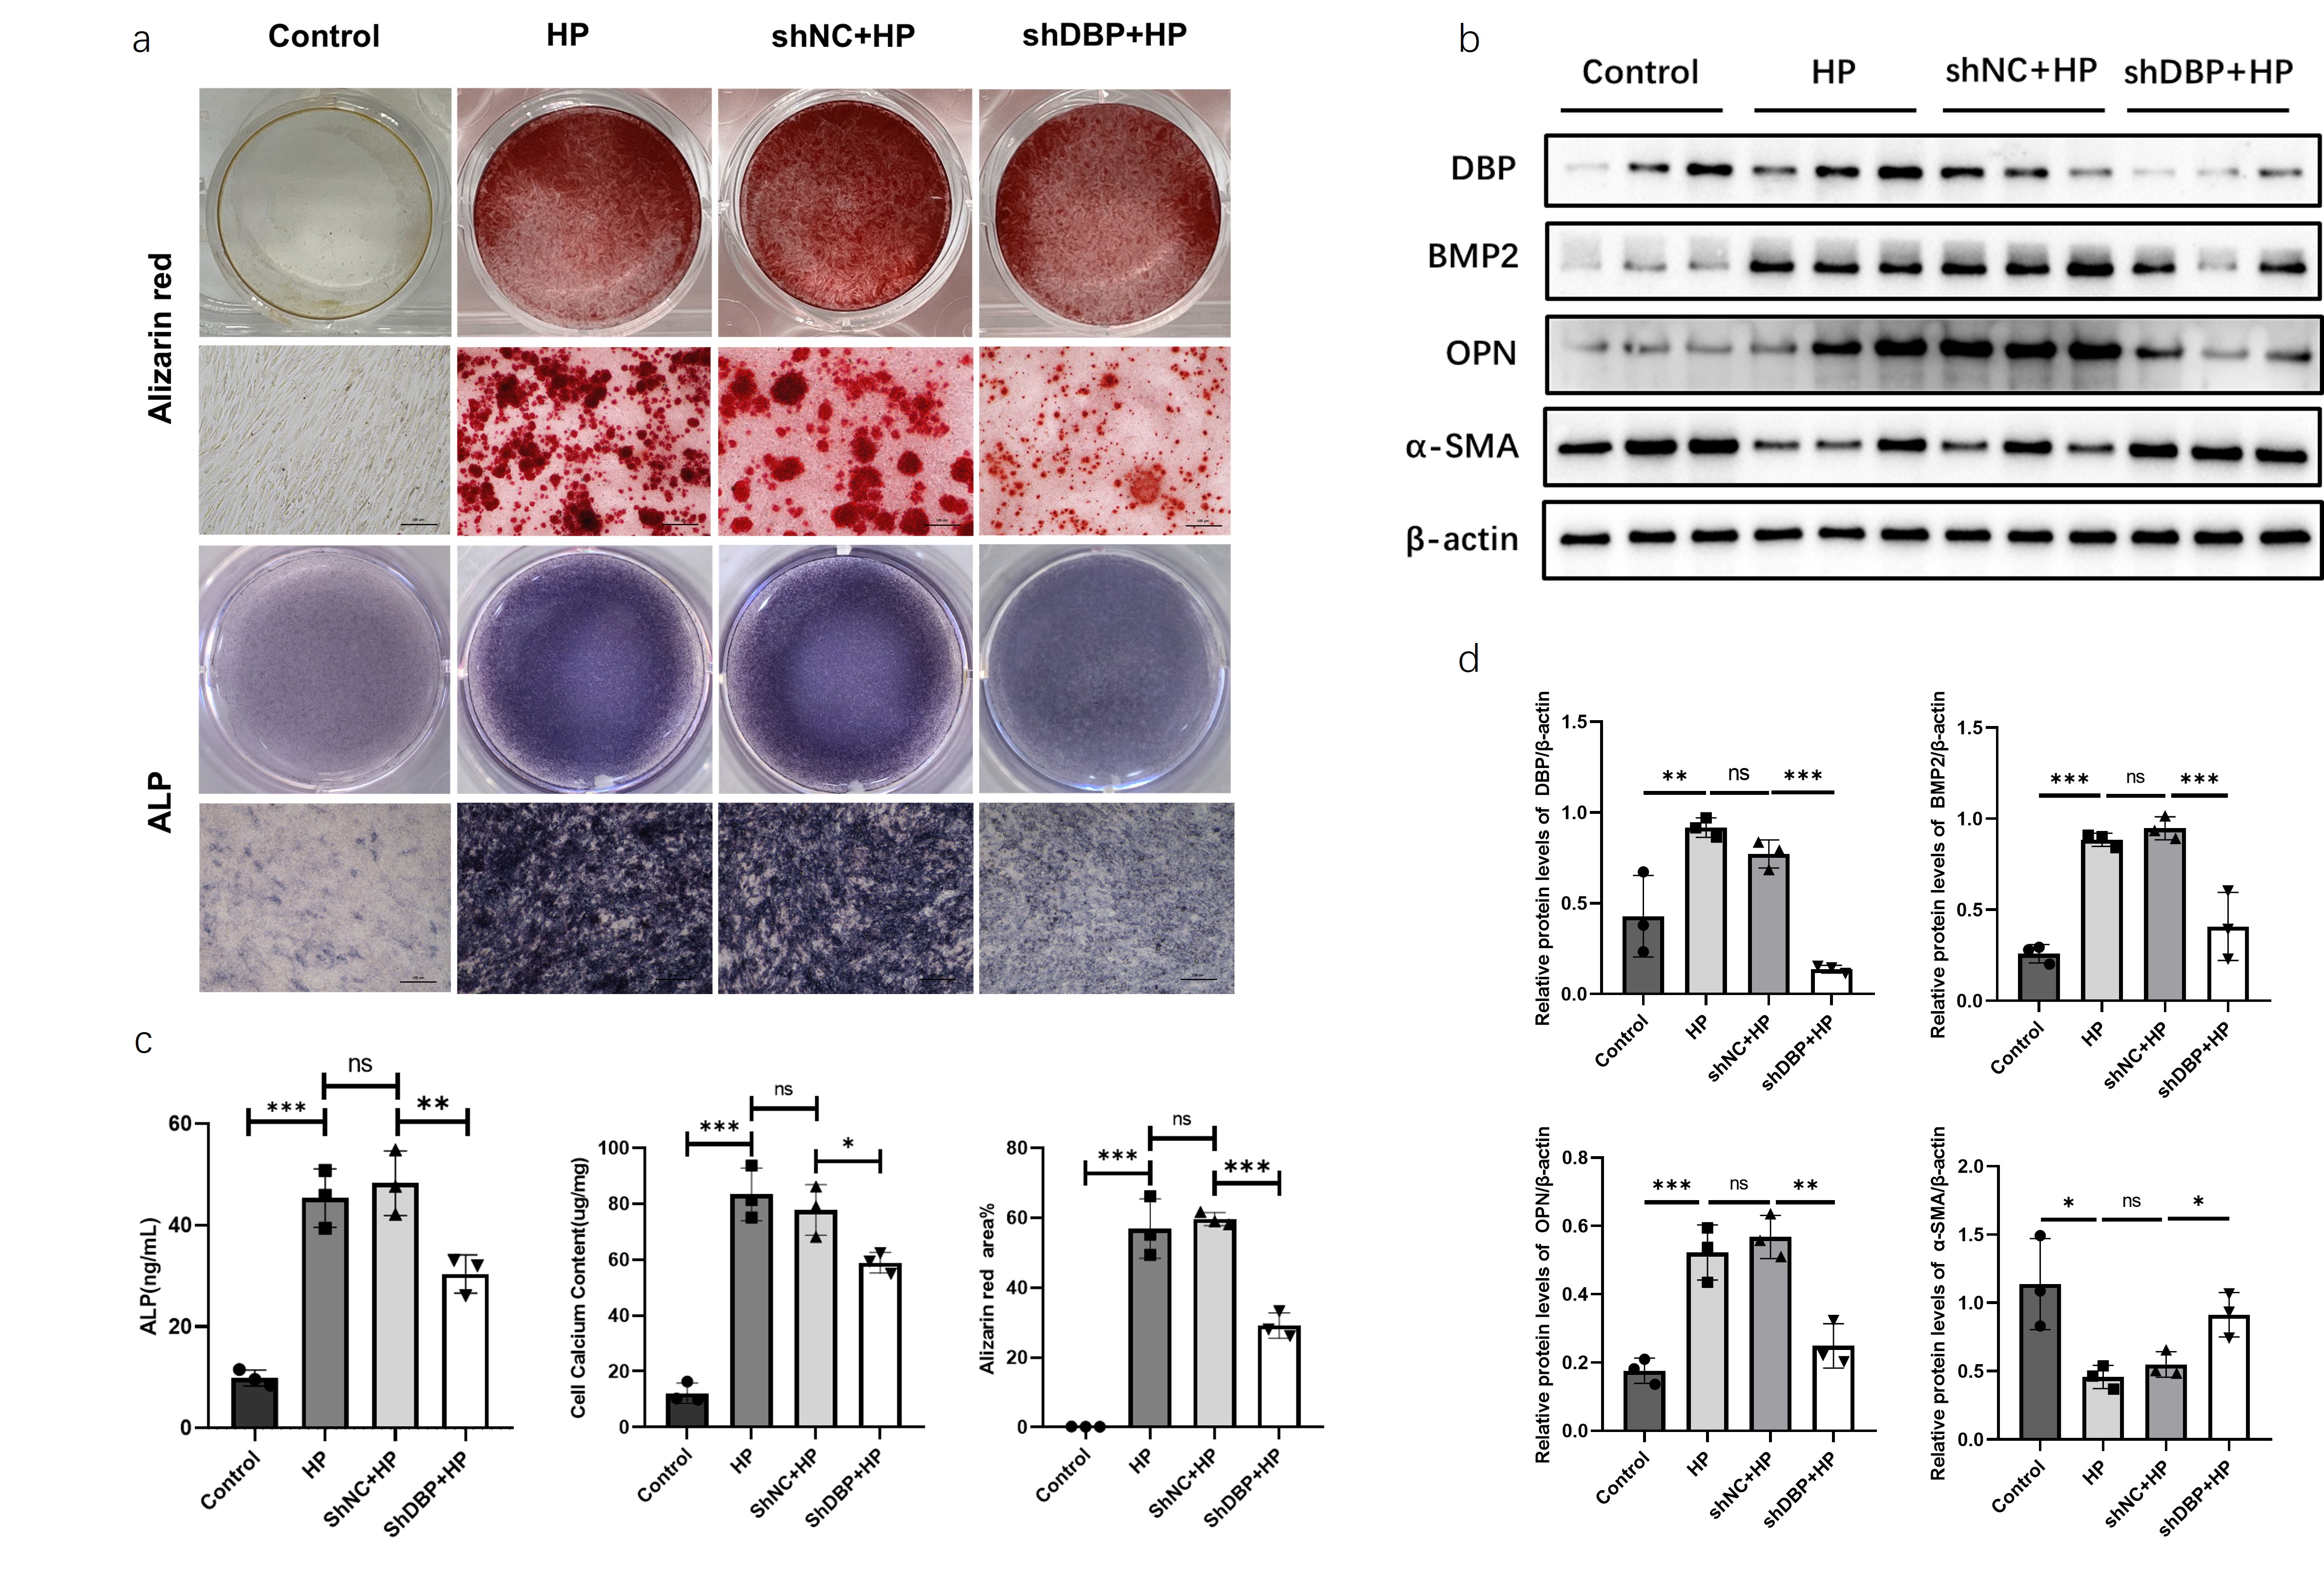
MOVAS
cells with stable DBP knockout were established using lentiviral transfection,
including control group (Control), calcification induction group (HP),
lentiviral negative control + calcification induction group (shNC+HP), and DBP
overexpression + calcification induction group (shDBP+HP). After stable
culture, all groups were induced with calcification medium for osteogenic
differentiation, with medium changes every 2-3 days, for 7 days. Comparison of
calcium salt deposition among different treatment groups showed that the DBP
knockout group had a reduced positive area of alizarin red staining compared to
the calcification induction group (Figure 2a). The DBP knockout group showed
significantly reduced ALP content in the cell supernatant, significantly
reduced alizarin red staining area, and significantly reduced calcium ion
content compared to the calcification induction group (Figure 2c).
Additionally, western blot analysis of OPN, α-SMA, BMP2, and DBP protein
expression levels in each group revealed that the DBP knockout group had
significantly decreased OPN and BMP2 protein expression levels and
significantly increased α-SMA protein expression levels (Figure 2b). These
results suggest that DBP knockout can ameliorate cellular calcification.
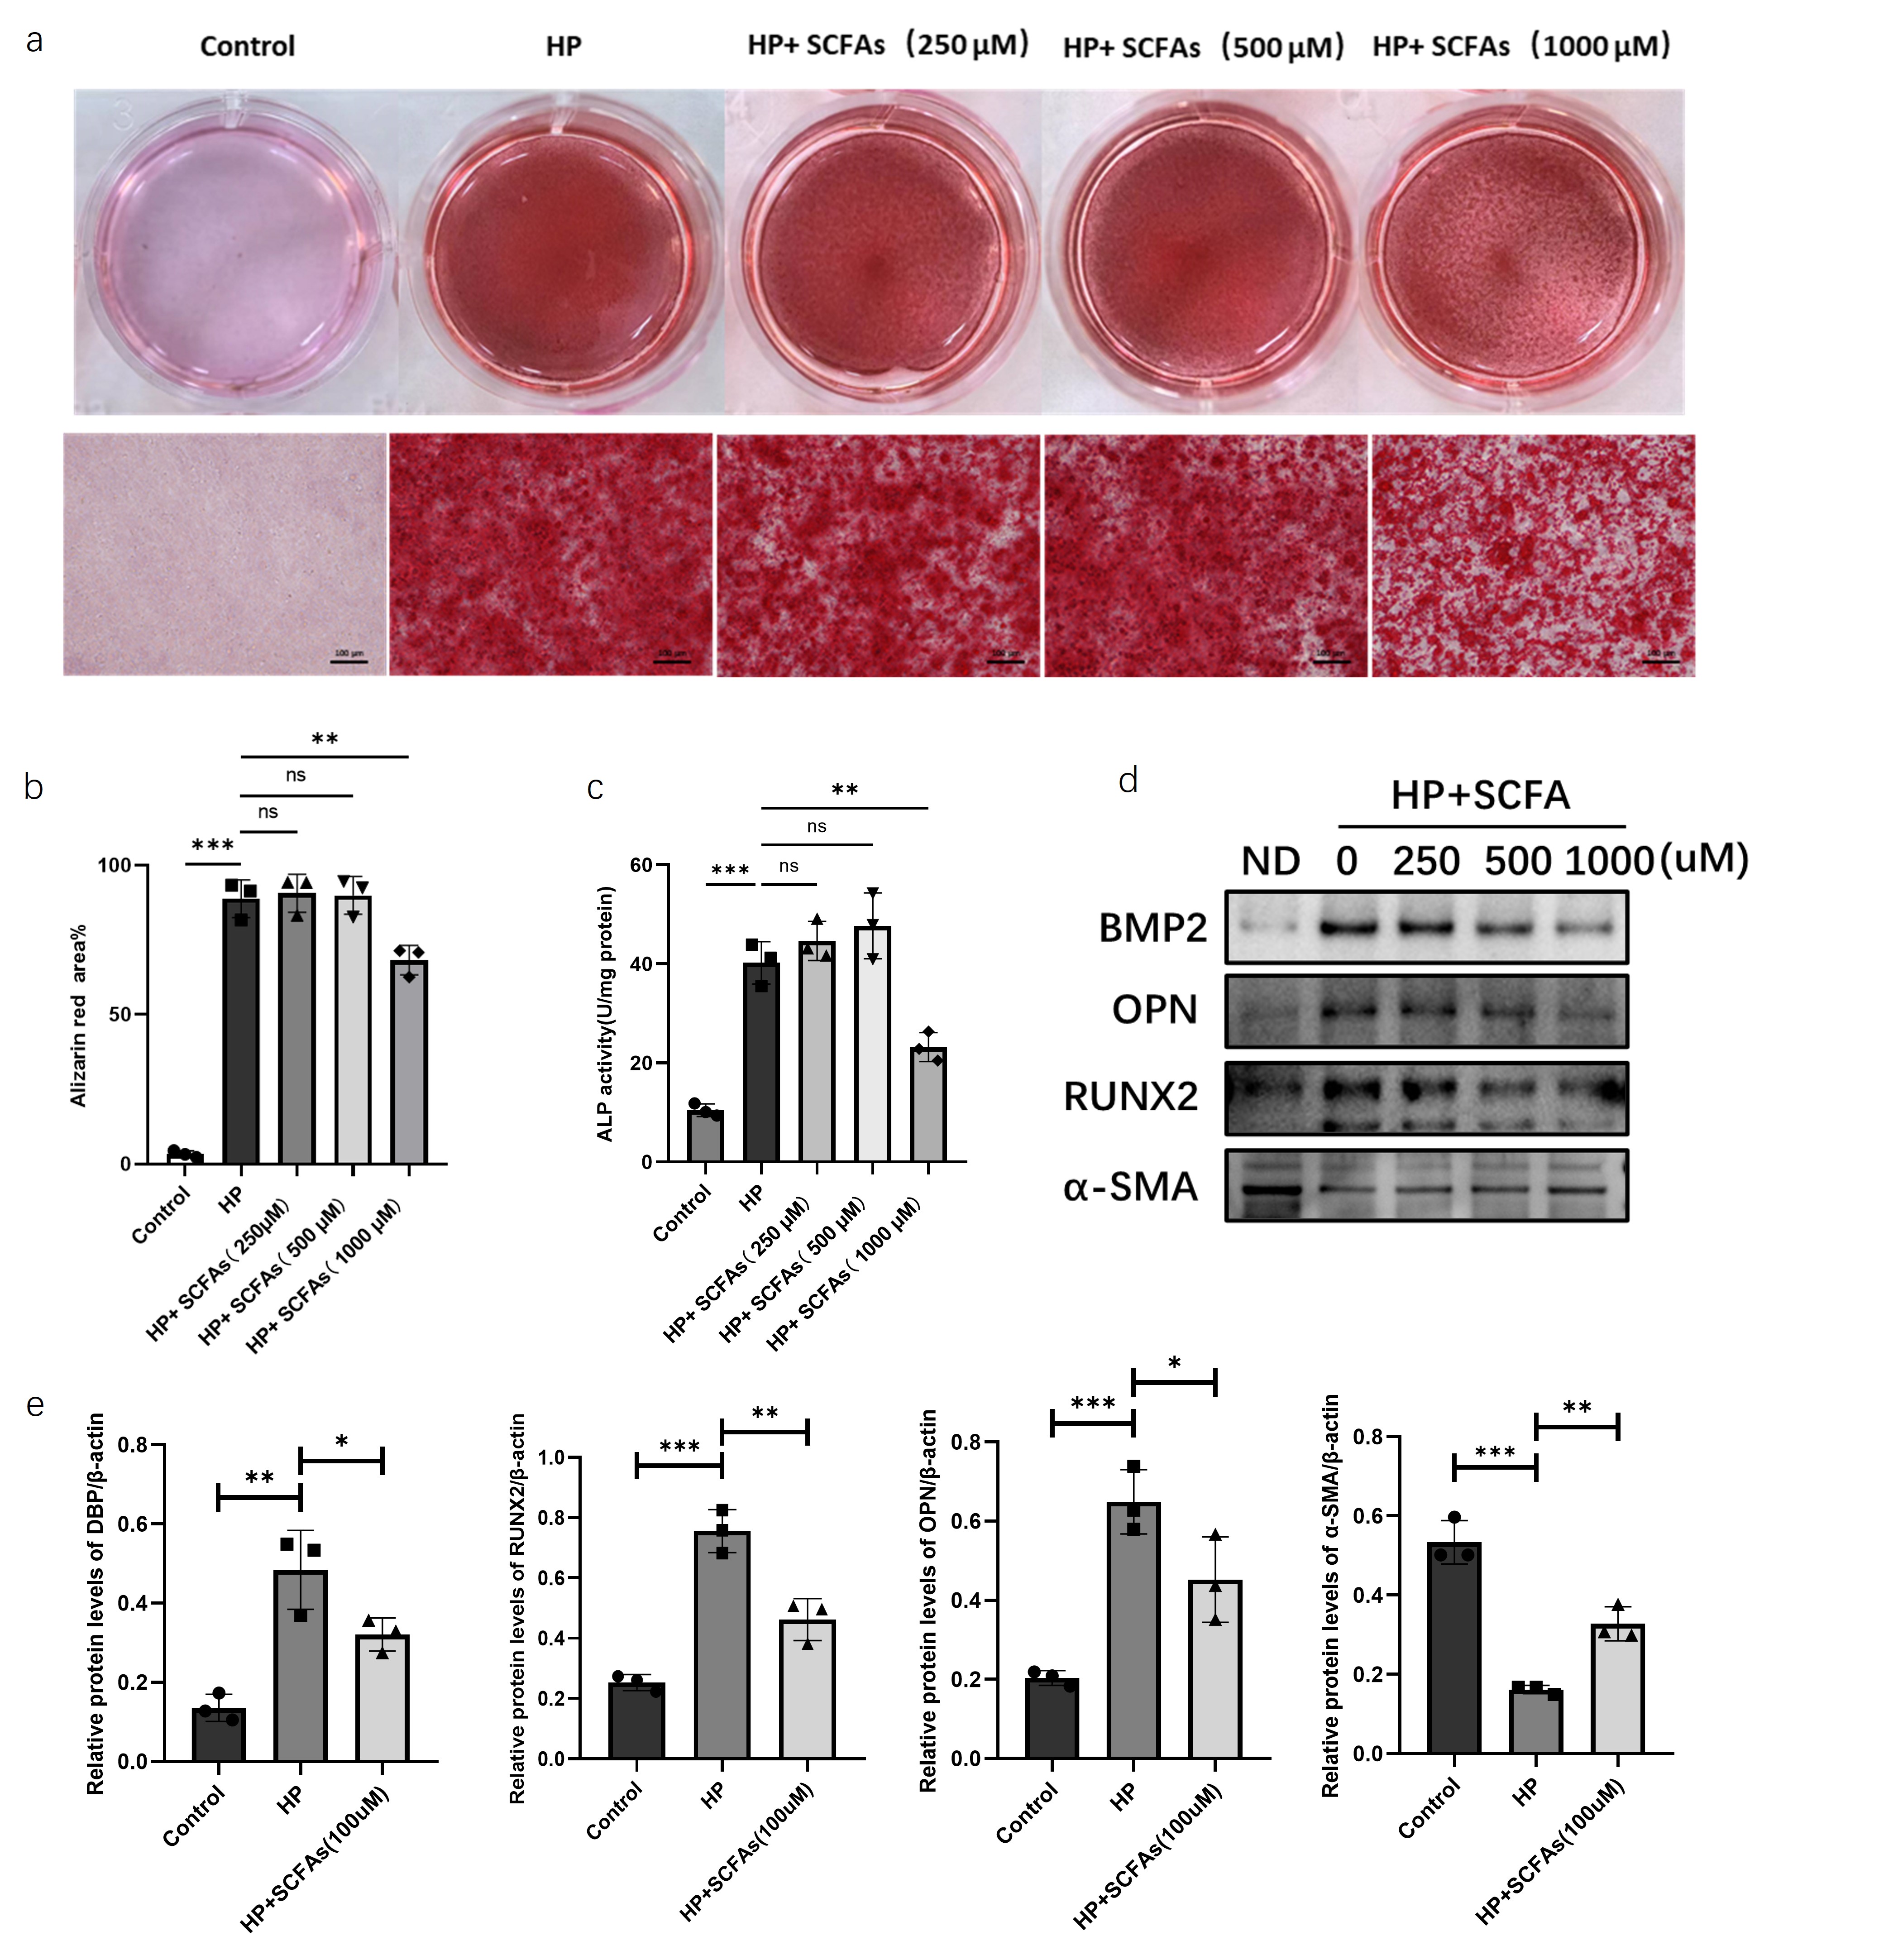
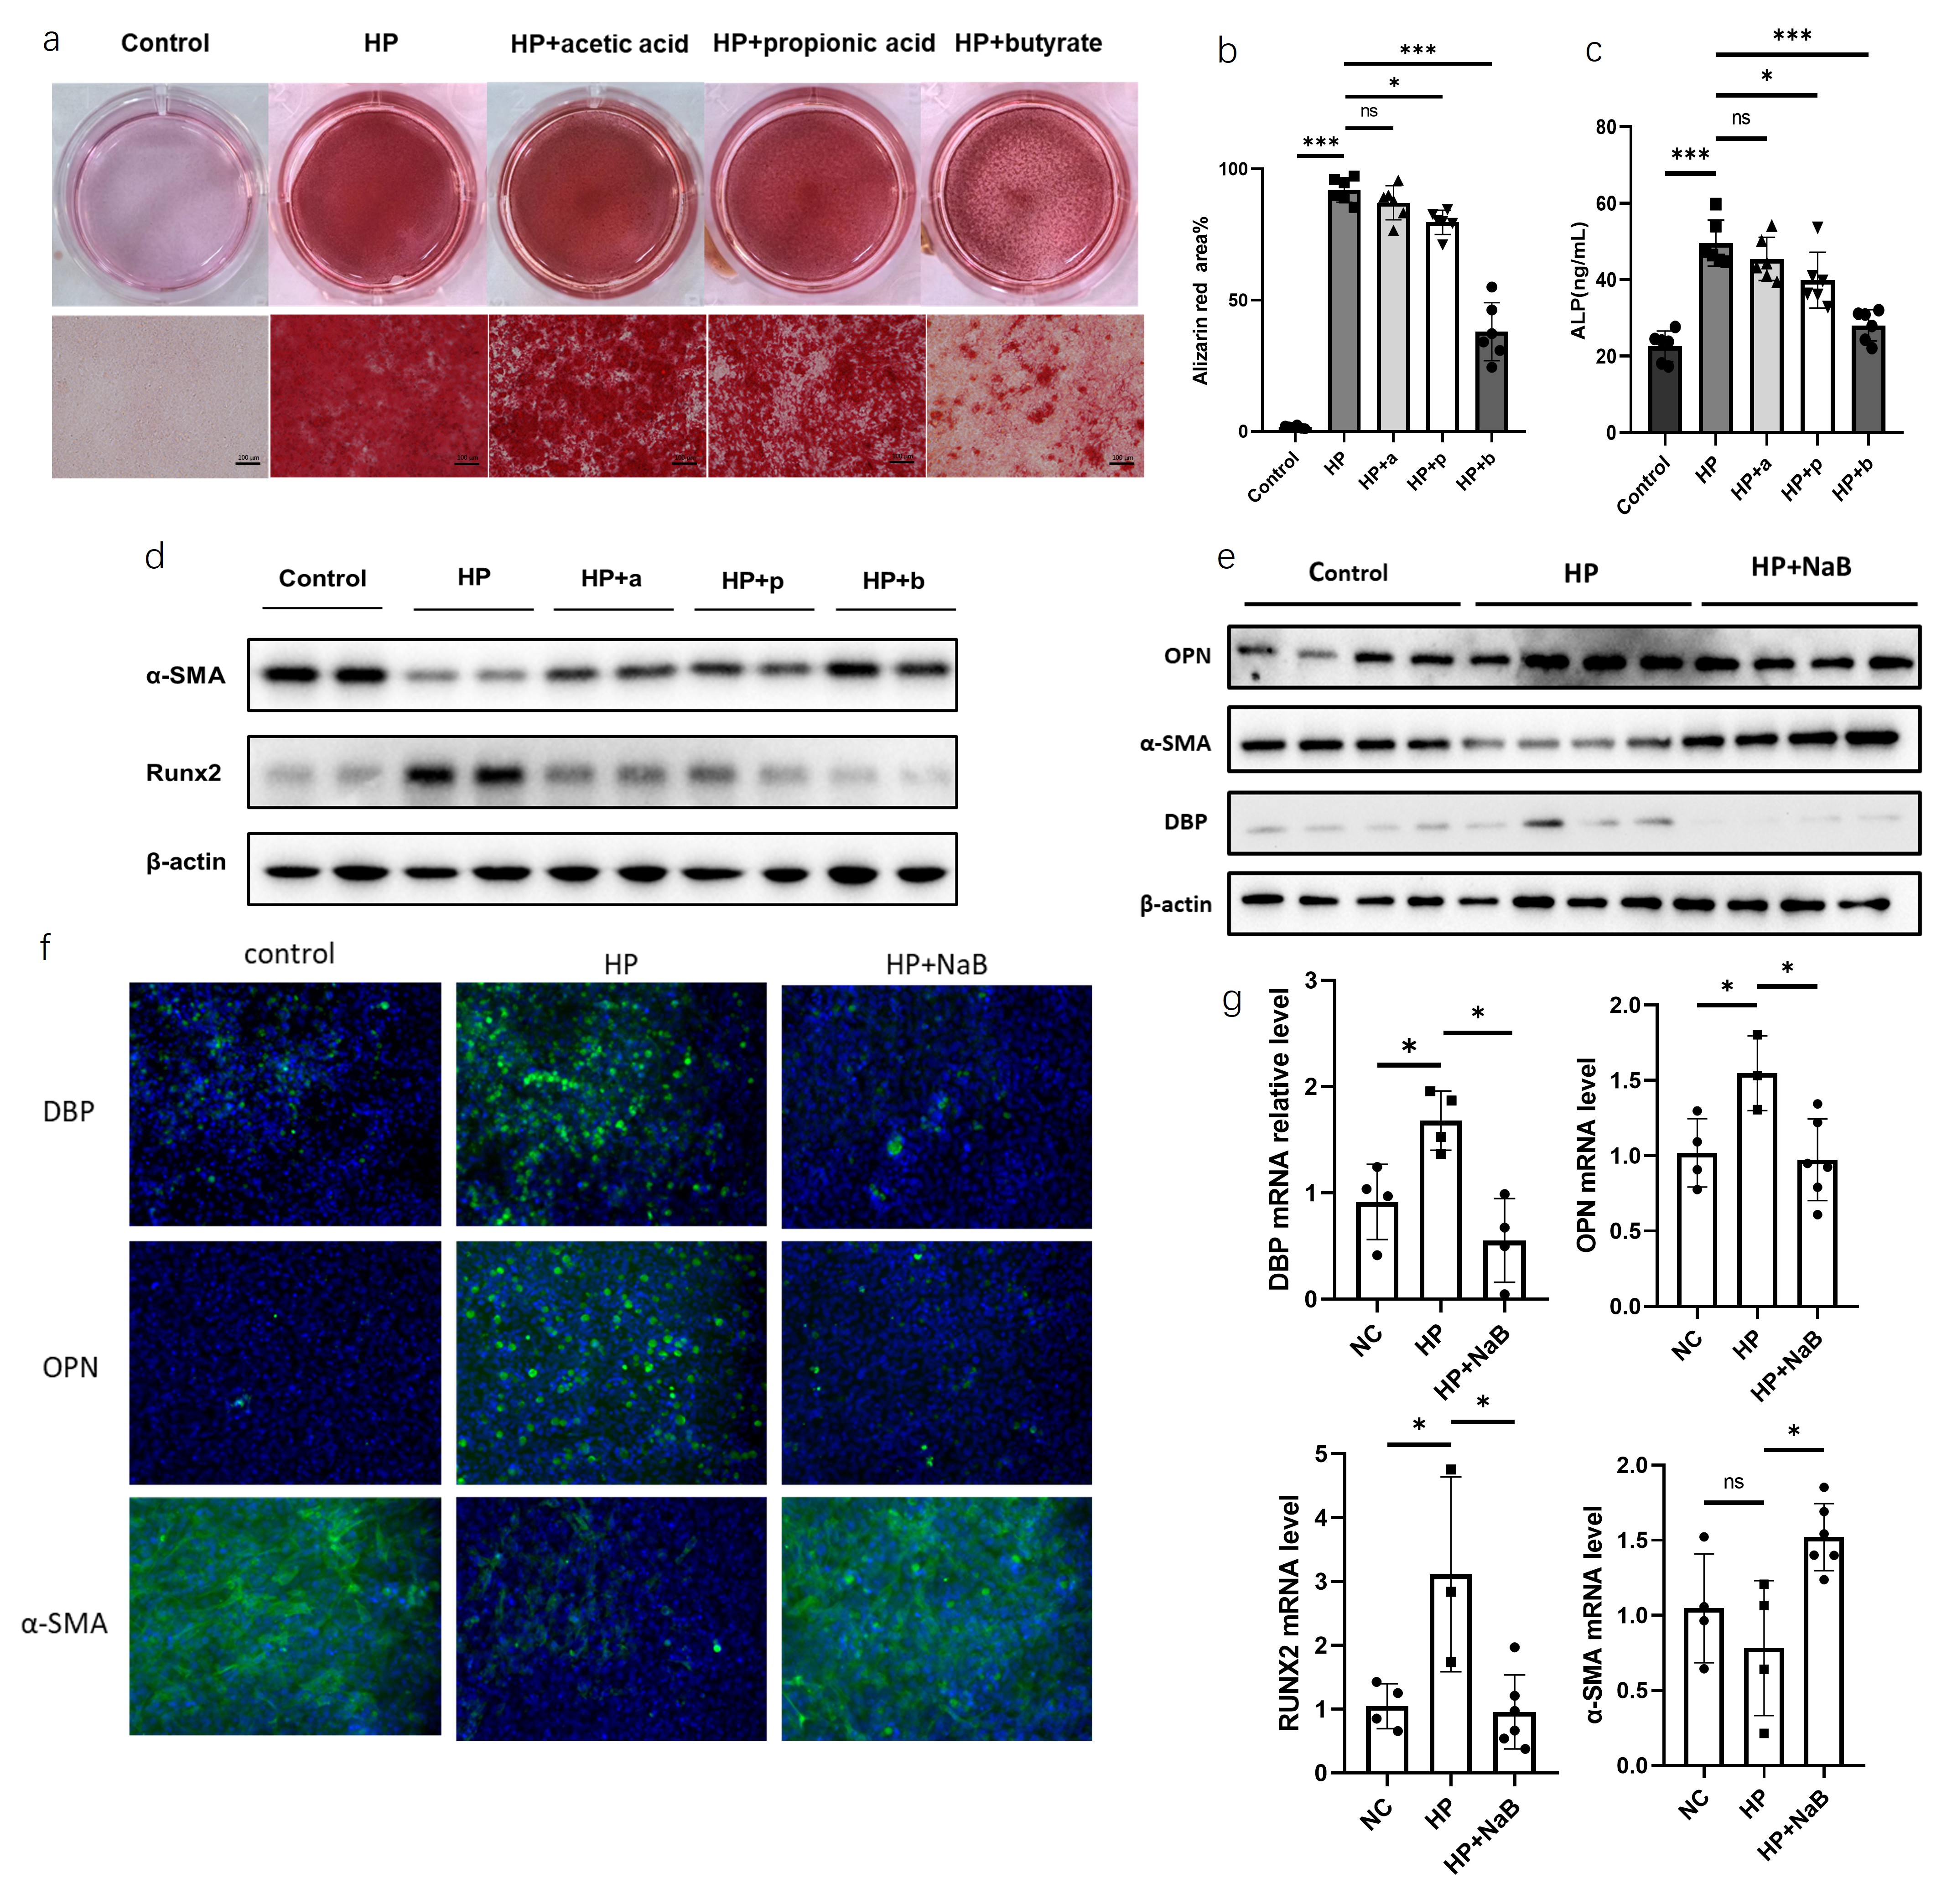
Alizarin red staining of MOVAS cells induced for calcification and treated with different concentrations of SCFAs mixture showed no significant difference in the positive area of alizarin red staining between cells induced for calcification and those simultaneously treated with 250μM and 500μM SCFAs mixture. However, the positive area of alizarin red staining was significantly reduced in cells treated with 1000μM SCFAs mixture compared to those only induced for calcification (Figure 3a-b), and alkaline phosphatase activity was significantly decreased (Figure 3c). Further evaluation of the effect of SCFAs on the expression levels of calcification-related markers by western blot revealed that SCFAs intervention significantly decreased the protein expression levels of osteogenic markers BMP2, OPN, and RUNX2, and significantly increased the expression level of the vascular smooth muscle marker α-SMA (Figure 3d). q-PCR results showed that SCFAs intervention significantly decreased DBP, OPN, and RUNX2 mRNA levels and significantly increased α-SMA mRNA levels (Figure 3e).
To
clarify the effects of acetate, propionate, and butyrate in the SCFAs mixture
on the degree of calcification in MOVAS cells under calcification induction,
stably cultured and viable MOVAS cells were treated with 1000μM acetate,
propionate, or butyrate under calcification medium for 7 days, designated as
control group (Control), calcification induction group (HP), acetate
intervention group (HP+a), propionate intervention group (HP+p), and butyrate
intervention group (HP+b). After 7 days, alizarin red staining of each group
showed no significant difference in the positive area between the acetate
intervention group and the calcification induction group. However, the
propionate and butyrate intervention groups showed significantly reduced
positive areas of alizarin red staining compared to the calcification induction
group, with the butyrate intervention group showing the most significant
improvement (Figure 4a). Microscopic images of alizarin red staining for each
group were taken and statistically analyzed using ImageJ, revealing significant
differences in alizarin red staining area between the acetate intervention
group and the calcification induction group, and significant differences
between the propionate and butyrate intervention groups and the calcification
induction group (Figure 4b). Compared to the calcification induction group, the
acetate intervention group showed no significant difference in alkaline
phosphatase content, while the propionate and butyrate intervention groups
showed significantly reduced alkaline phosphatase content (Figure 4c). Further
western blot analysis of the osteogenic marker RUNX2 and the vascular smooth
muscle marker α-SMA in each group showed that propionate and butyrate
interventions significantly decreased RUNX2 protein expression levels and
significantly increased α-SMA protein expression levels (Figure 4d). The
butyrate intervention group showed significantly reduced DBP expression (Figure
4e-f), and qPCR results showed the same trend (Figure 4g). In summary,
propionate and butyrate improved calcification in MOVAS cells under
calcification induction, with butyrate having a stronger effect than
propionate.
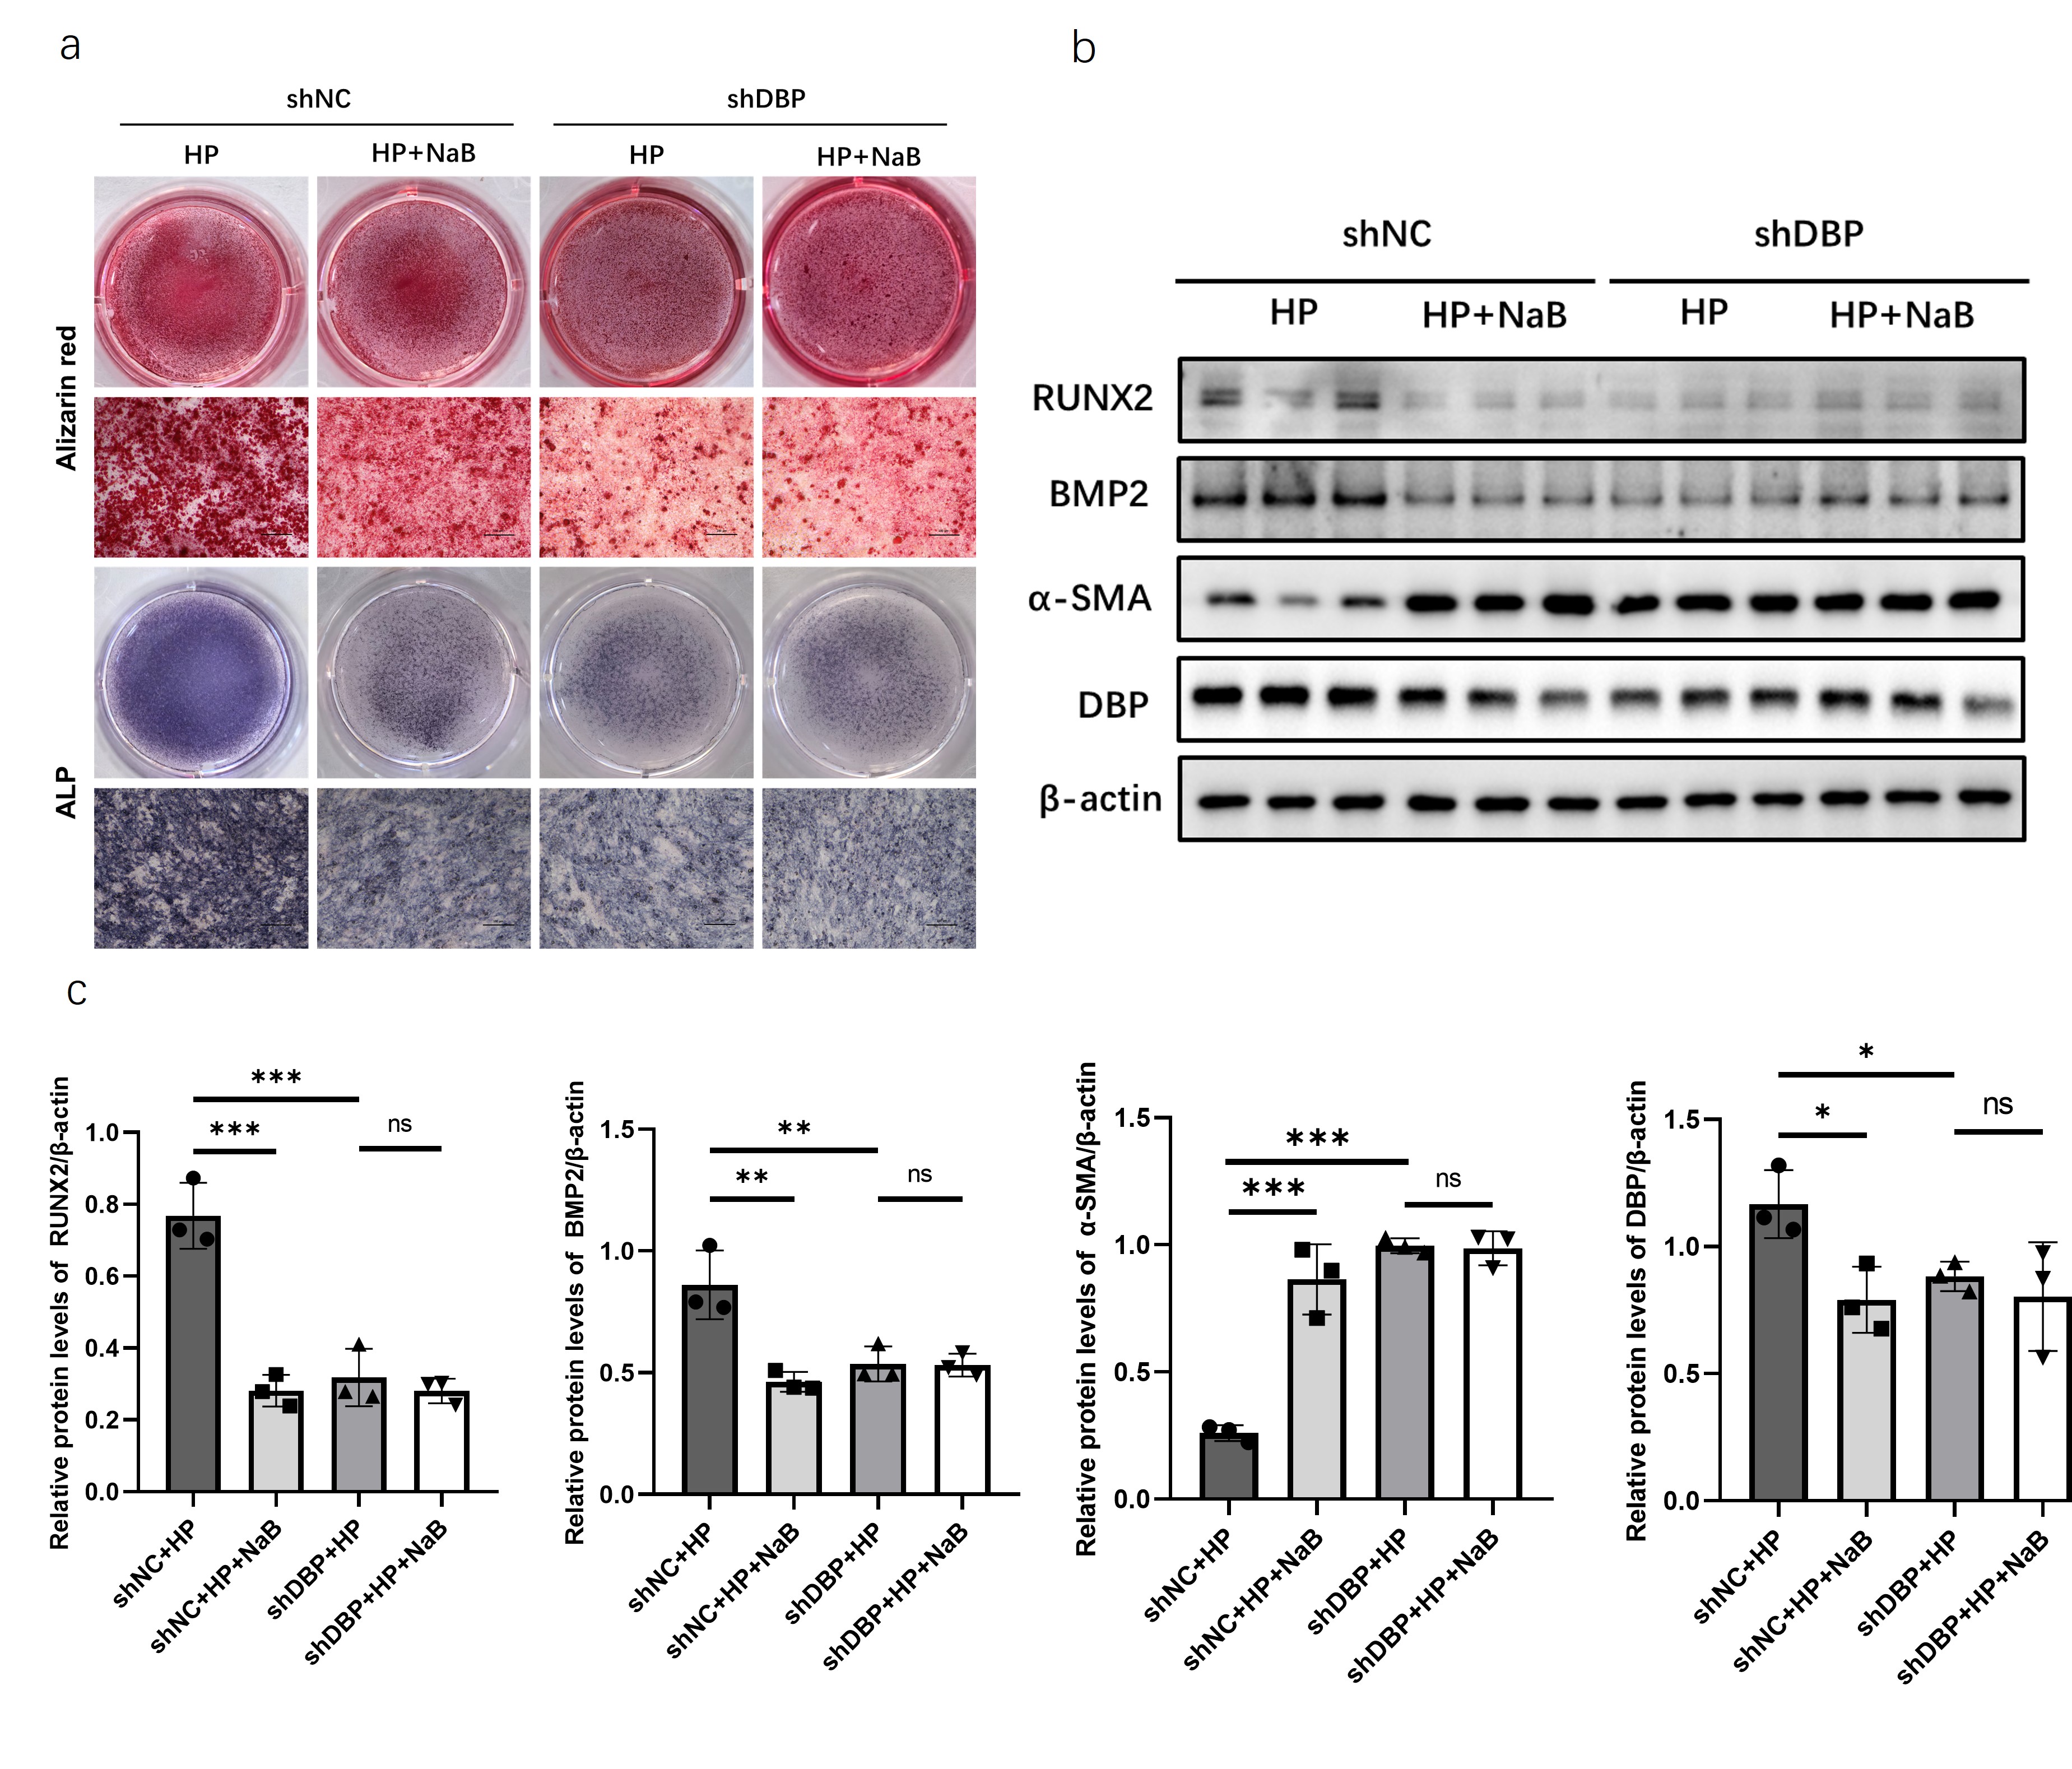
To
confirm that butyrate improves vascular calcification by inhibiting DBP
expression, an osteogenic calcification model was induced in stably cultured
DBP-knockdown MOVAS cell lines and treated with butyrate. Compared to control
MOVAS cells, alizarin red staining showed that DBP-knockdown MOVAS cells had
significantly reduced calcium salt deposition and improved ALP staining under
calcification induction alone (Figure 5a). However, no additional improvement
was observed with simultaneous butyrate intervention. Western blot results also
confirmed that butyrate intervention did not further reduce calcification in
DBP-knockdown MOVAS cells (Figure 5b-c).
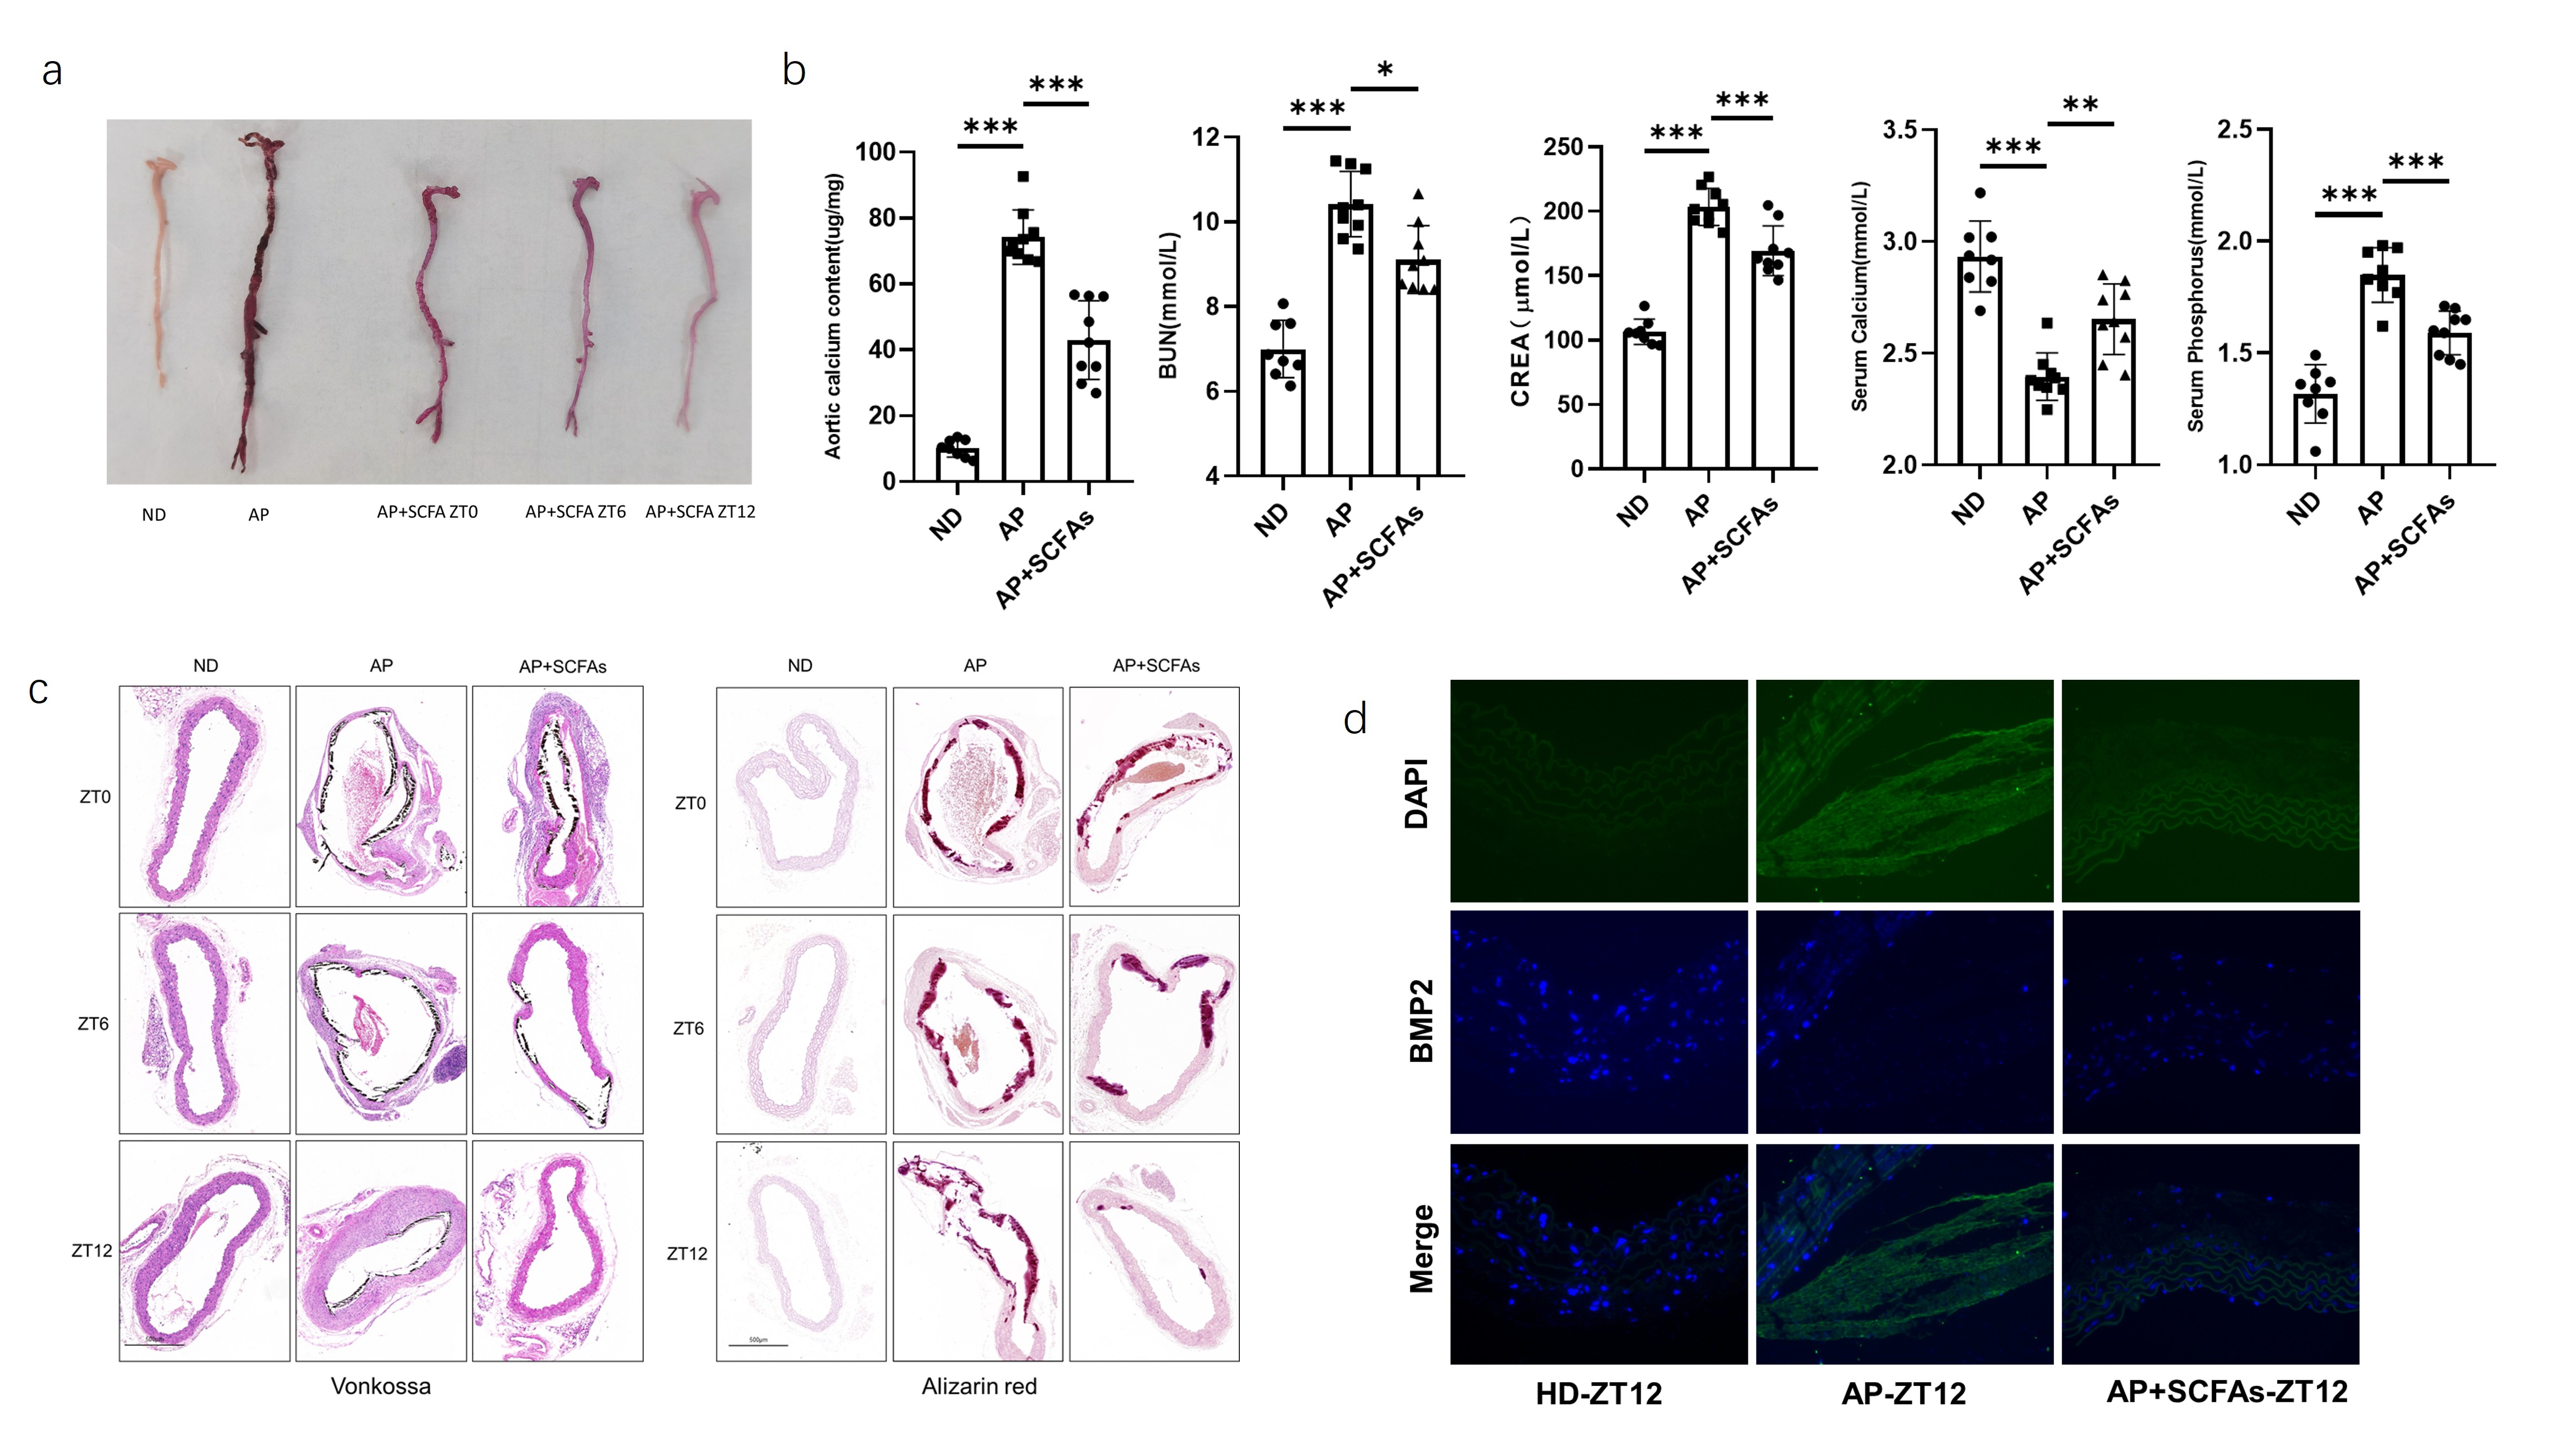
To
further verify the effect of SCFAs on CKD vascular calcification in mice and
explore potential mechanisms, a CKD calcification mouse model was established
using 5/6 nephrectomy combined with high-phosphorus feeding, and exogenous
SCFAs were supplemented at different daily time points (ZT0, ZT6, ZT12). After
8 weeks of intervention, vascular tissue samples were collected from each group
to compare the differences in vascular calcification phenotypes. Results for
aortic specimens from each group showed varying degrees of improvement in
aortic calcification in mice administered SCFAs at ZT0, ZT6, and ZT12 (Figure
6a). Kidney function and vascular calcium salt content were significantly
improved in SCFAs-supplemented mice (Figure 6b). Von Kossa staining and
alizarin red staining of aortic cross-sections from each time point (Figure 6c)
all showed varying degrees of improvement in aortic calcification in
SCFAs-intervened mice, with significantly reduced calcification in the timed
administration groups, and the most significant improvement in the ZT12
administration group. Subsequent immunofluorescence staining for BMP2 in aortic
samples from the control, calcification induction, and SCFAs intervention
groups at ZT12 showed that BMP2 expression in the aorta was significantly
reduced after SCFAs administration compared to the model group (Figure 6d). In
summary, SCFAs can improve CKD vascular calcification in vivo.
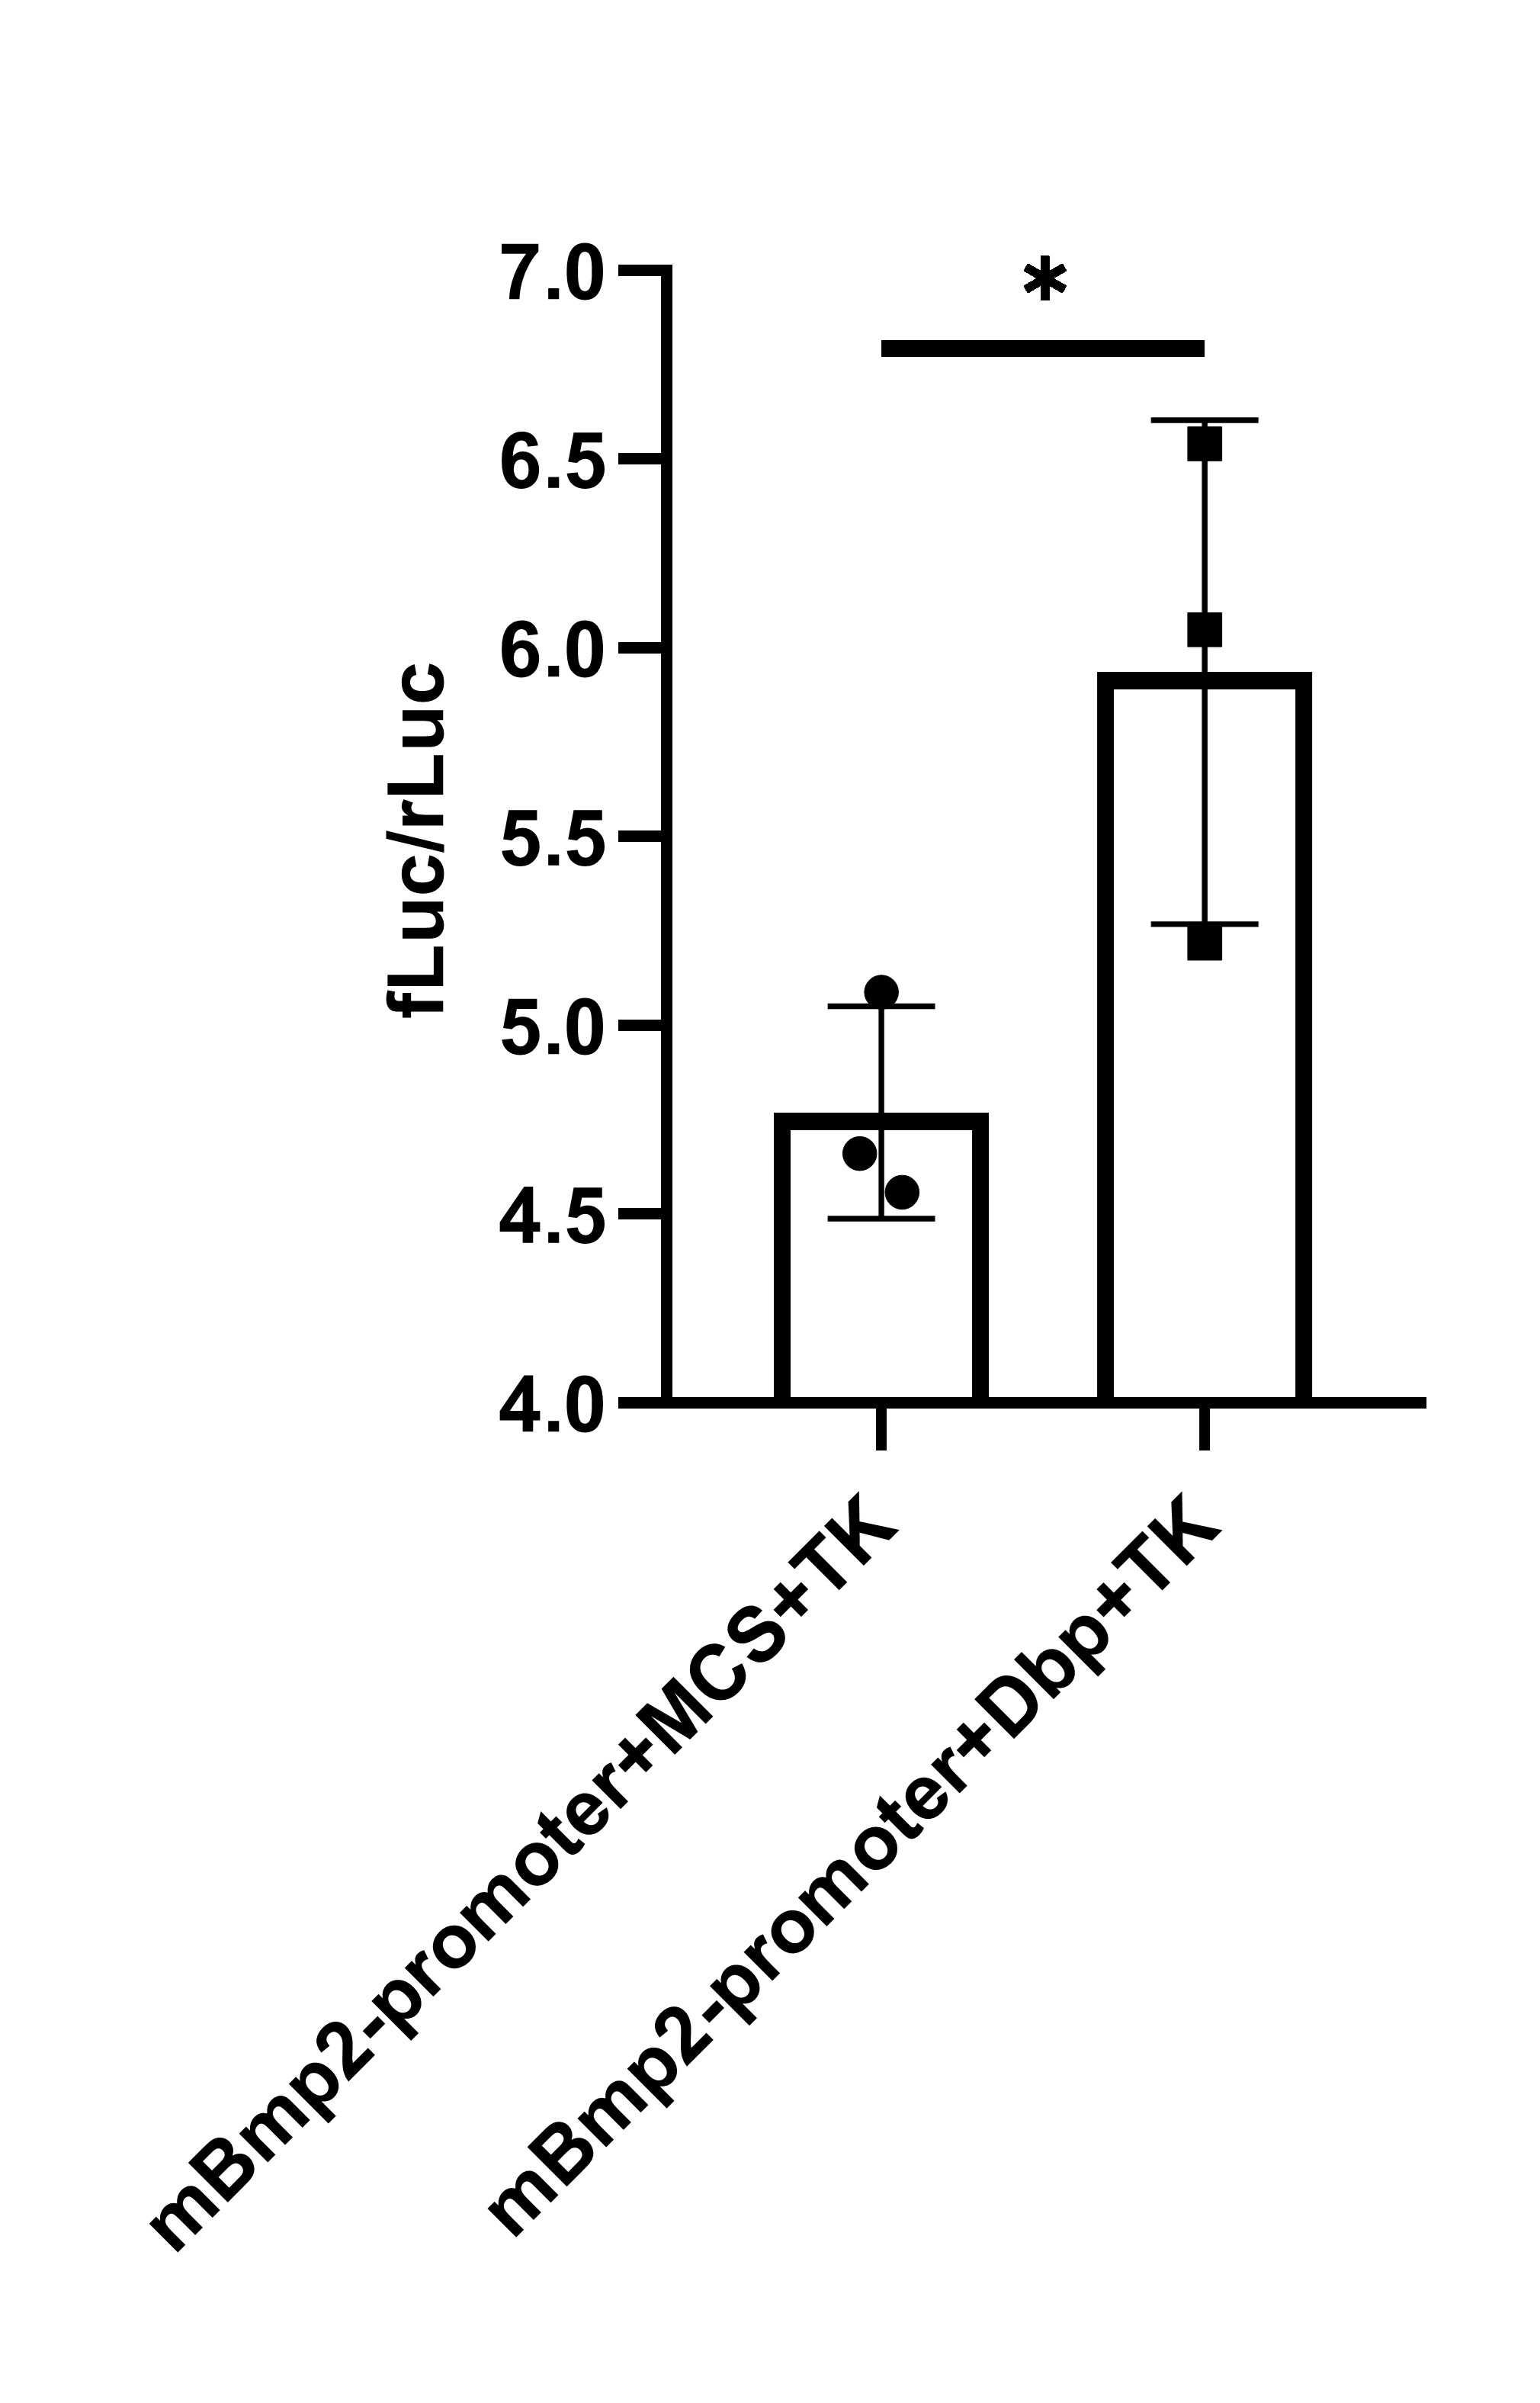
To
further clarify that DBP affects CKD vascular calcification by regulating BMP2,
a dual-luciferase reporter gene assay was performed, showing that DBP enhances
BMP2 promoter activity and promotes BMP2 transcription (Figure 7).