Figure1 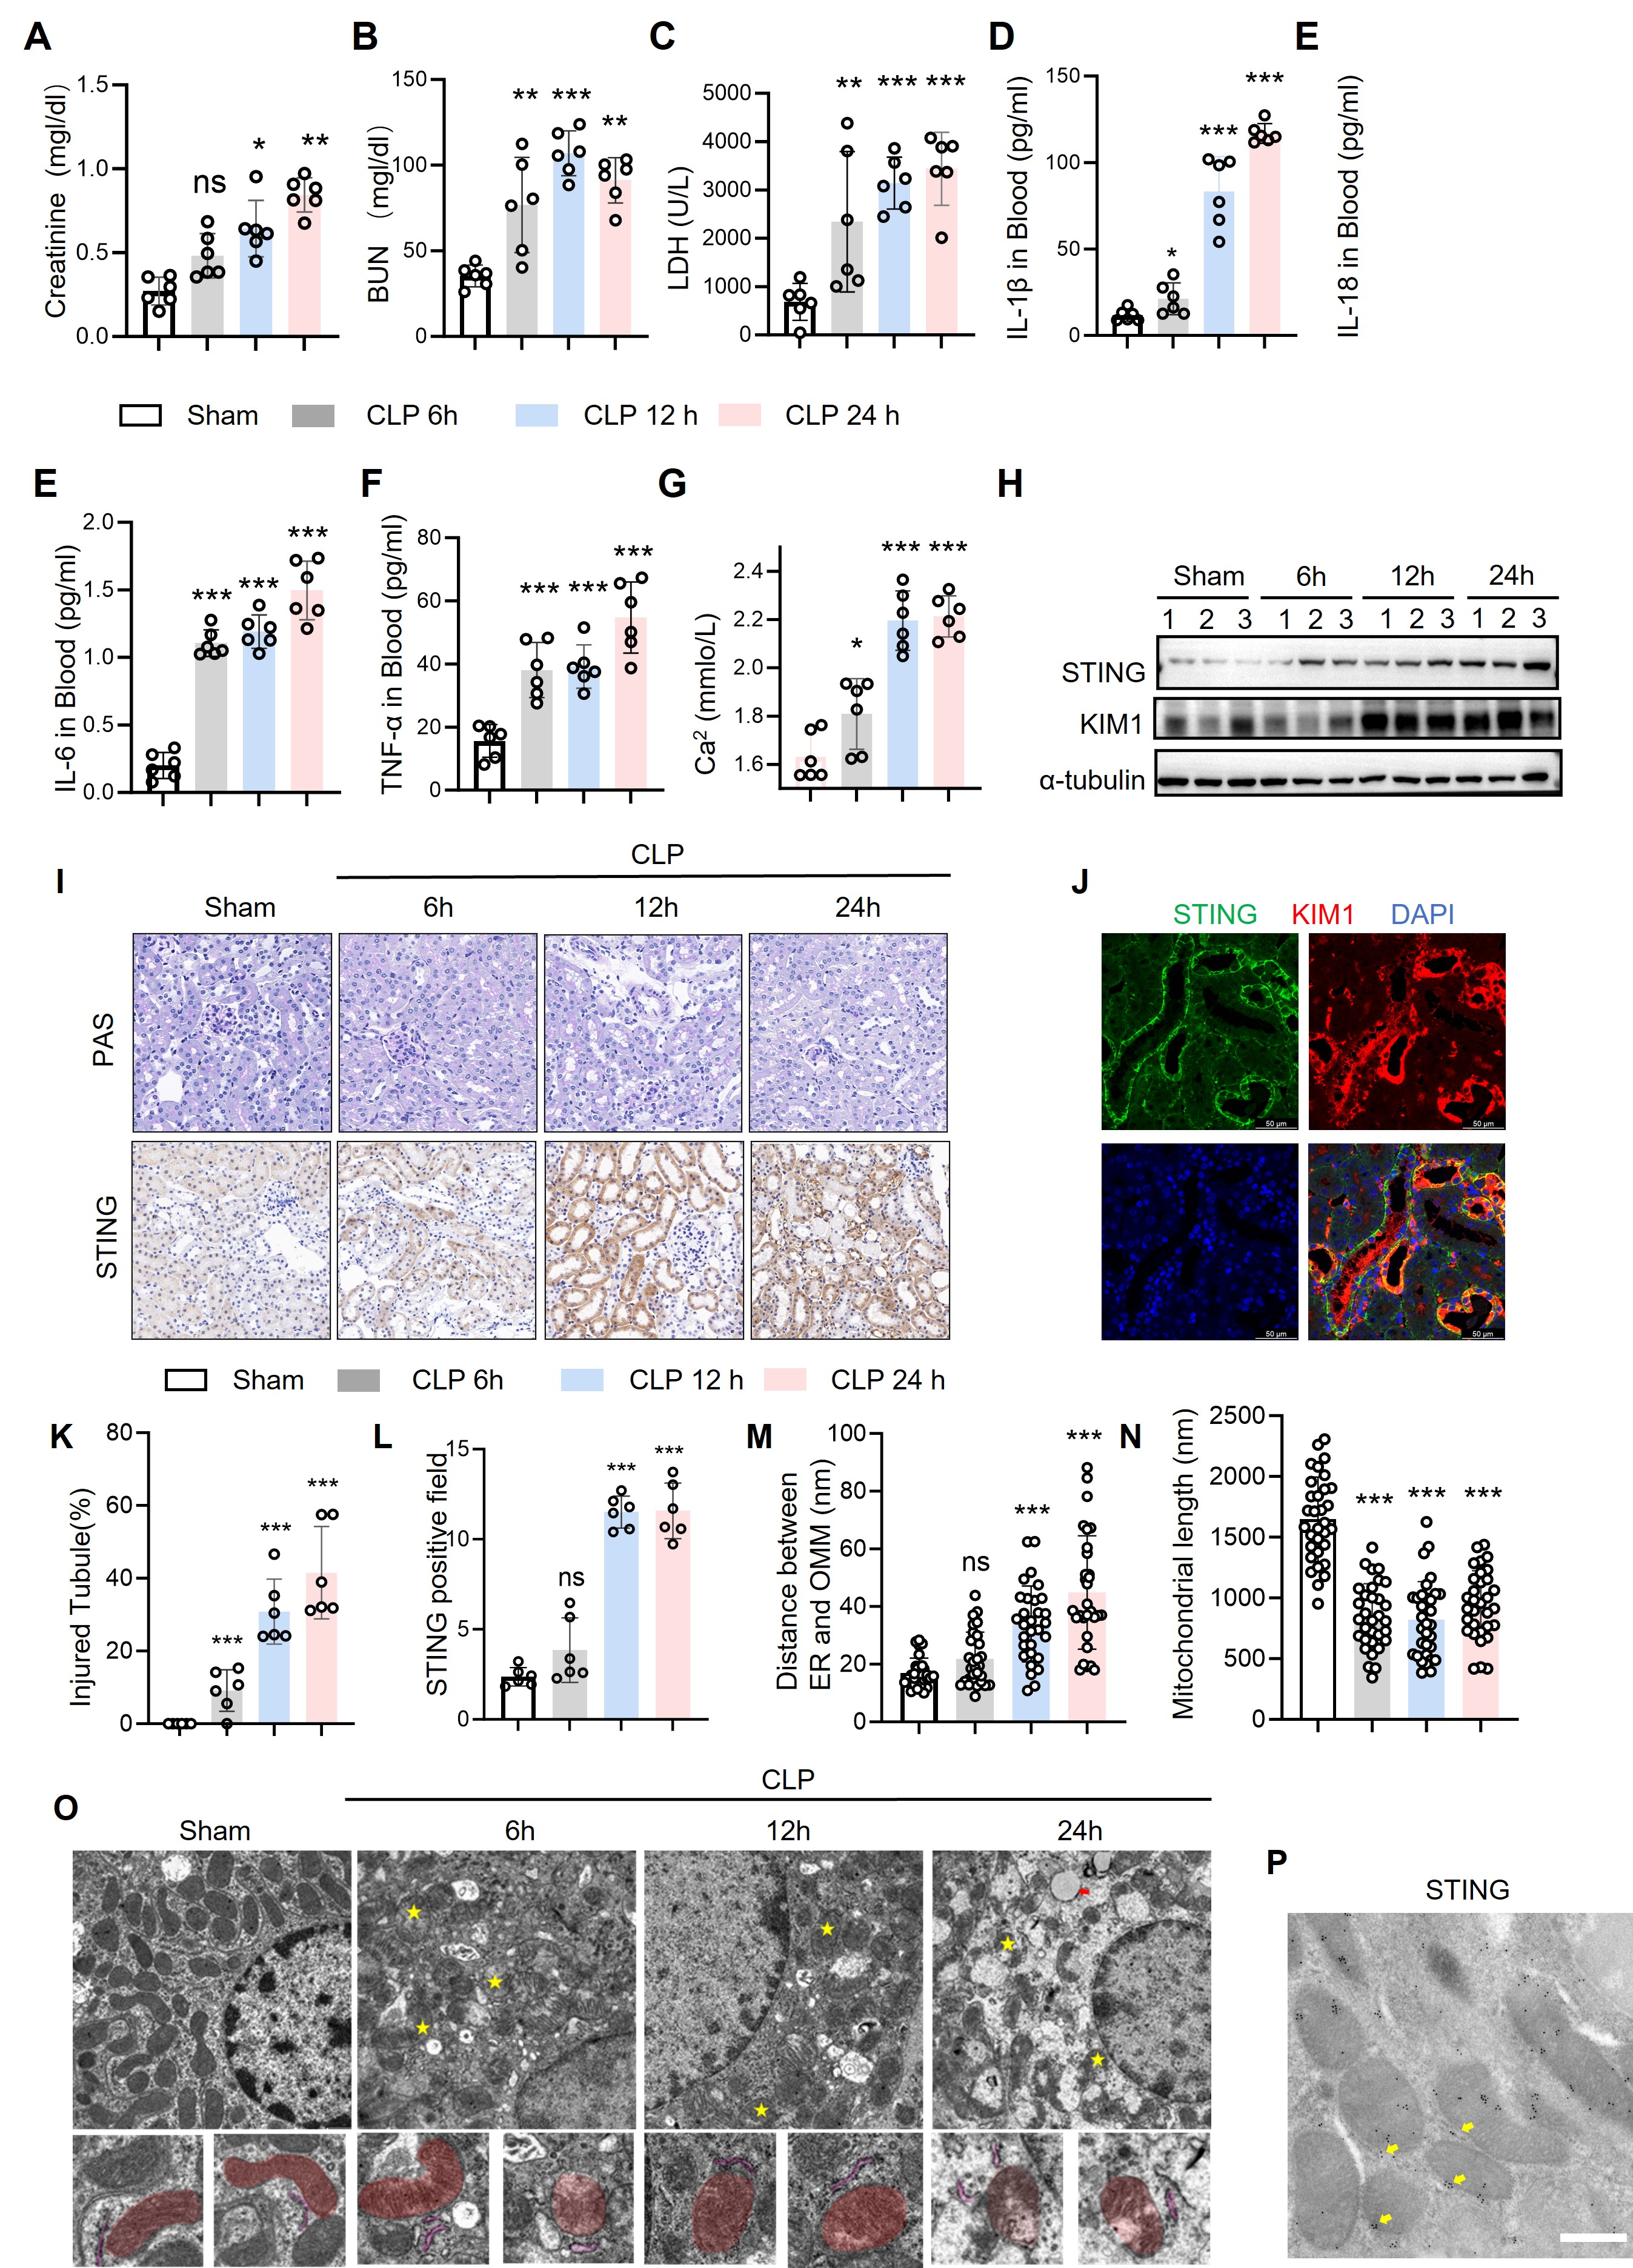
(A–C) Serum levels of creatinine, blood urea nitrogen (BUN), and lactate dehydrogenase (LDH) in mice subjected to cecal ligation and puncture (CLP) for 6, 12, or 24 h, compared with sham-operated controls (n = 8 per group).
(D–F) Circulating proinflammatory cytokines IL-1β, IL-6, and TNF-α were significantly elevated in CLP-induced sepsis compared with sham controls (n = 6–8).
(G) Serum calcium concentration was increased following CLP, indicating systemic calcium imbalance during sepsis (n = 8).
(H) Representative immunoblots showing time-dependent upregulation of STING and KIM-1 in kidney tissues from CLP mice at 6–24 h; α-tubulin served as a loading control.
(I) Periodic acid–Schiff (PAS) staining showing progressive tubular damage and STING immunohistochemical staining demonstrating increased tubular expression over time after CLP.
(J) Immunofluorescence staining for STING (green) and KIM-1 (red) showing colocalization in injured tubular segments; nuclei are counterstained with DAPI (blue).
(K–L) Quantification of tubular injury and STING-positive areas in kidney sections (n = 6).
(M–N) Transmission electron microscopy (TEM) analyses of renal tubular cells showing an increased distance between ER and outer mitochondrial membrane (OMM) and shortened mitochondrial length after CLP (n = 40–50 mitochondria per group).
(O) Representative TEM micrographs showing progressive mitochondrial cristae disruption and ER swelling in renal tubules at 6–24 h post-CLP; yellow asterisks mark MAM regions; lower panels highlight segmented mitochondria (pseudo-colored red).
(P) Immunogold electron microscopy confirming the localization of STING (yellow dots) at mitochondria-associated membranes (MAMs).
Data are presented as mean ± SEM; ns, not significant; *p < 0.05, **p < 0.01, ***p < 0.001, ****p < 0.0001 vs. sham (one-way ANOVA with Tukey’s post hoc test). Scale bars: (I, J) 50 μm; (O) 500 nm; (P) 200 nm.
Figure2 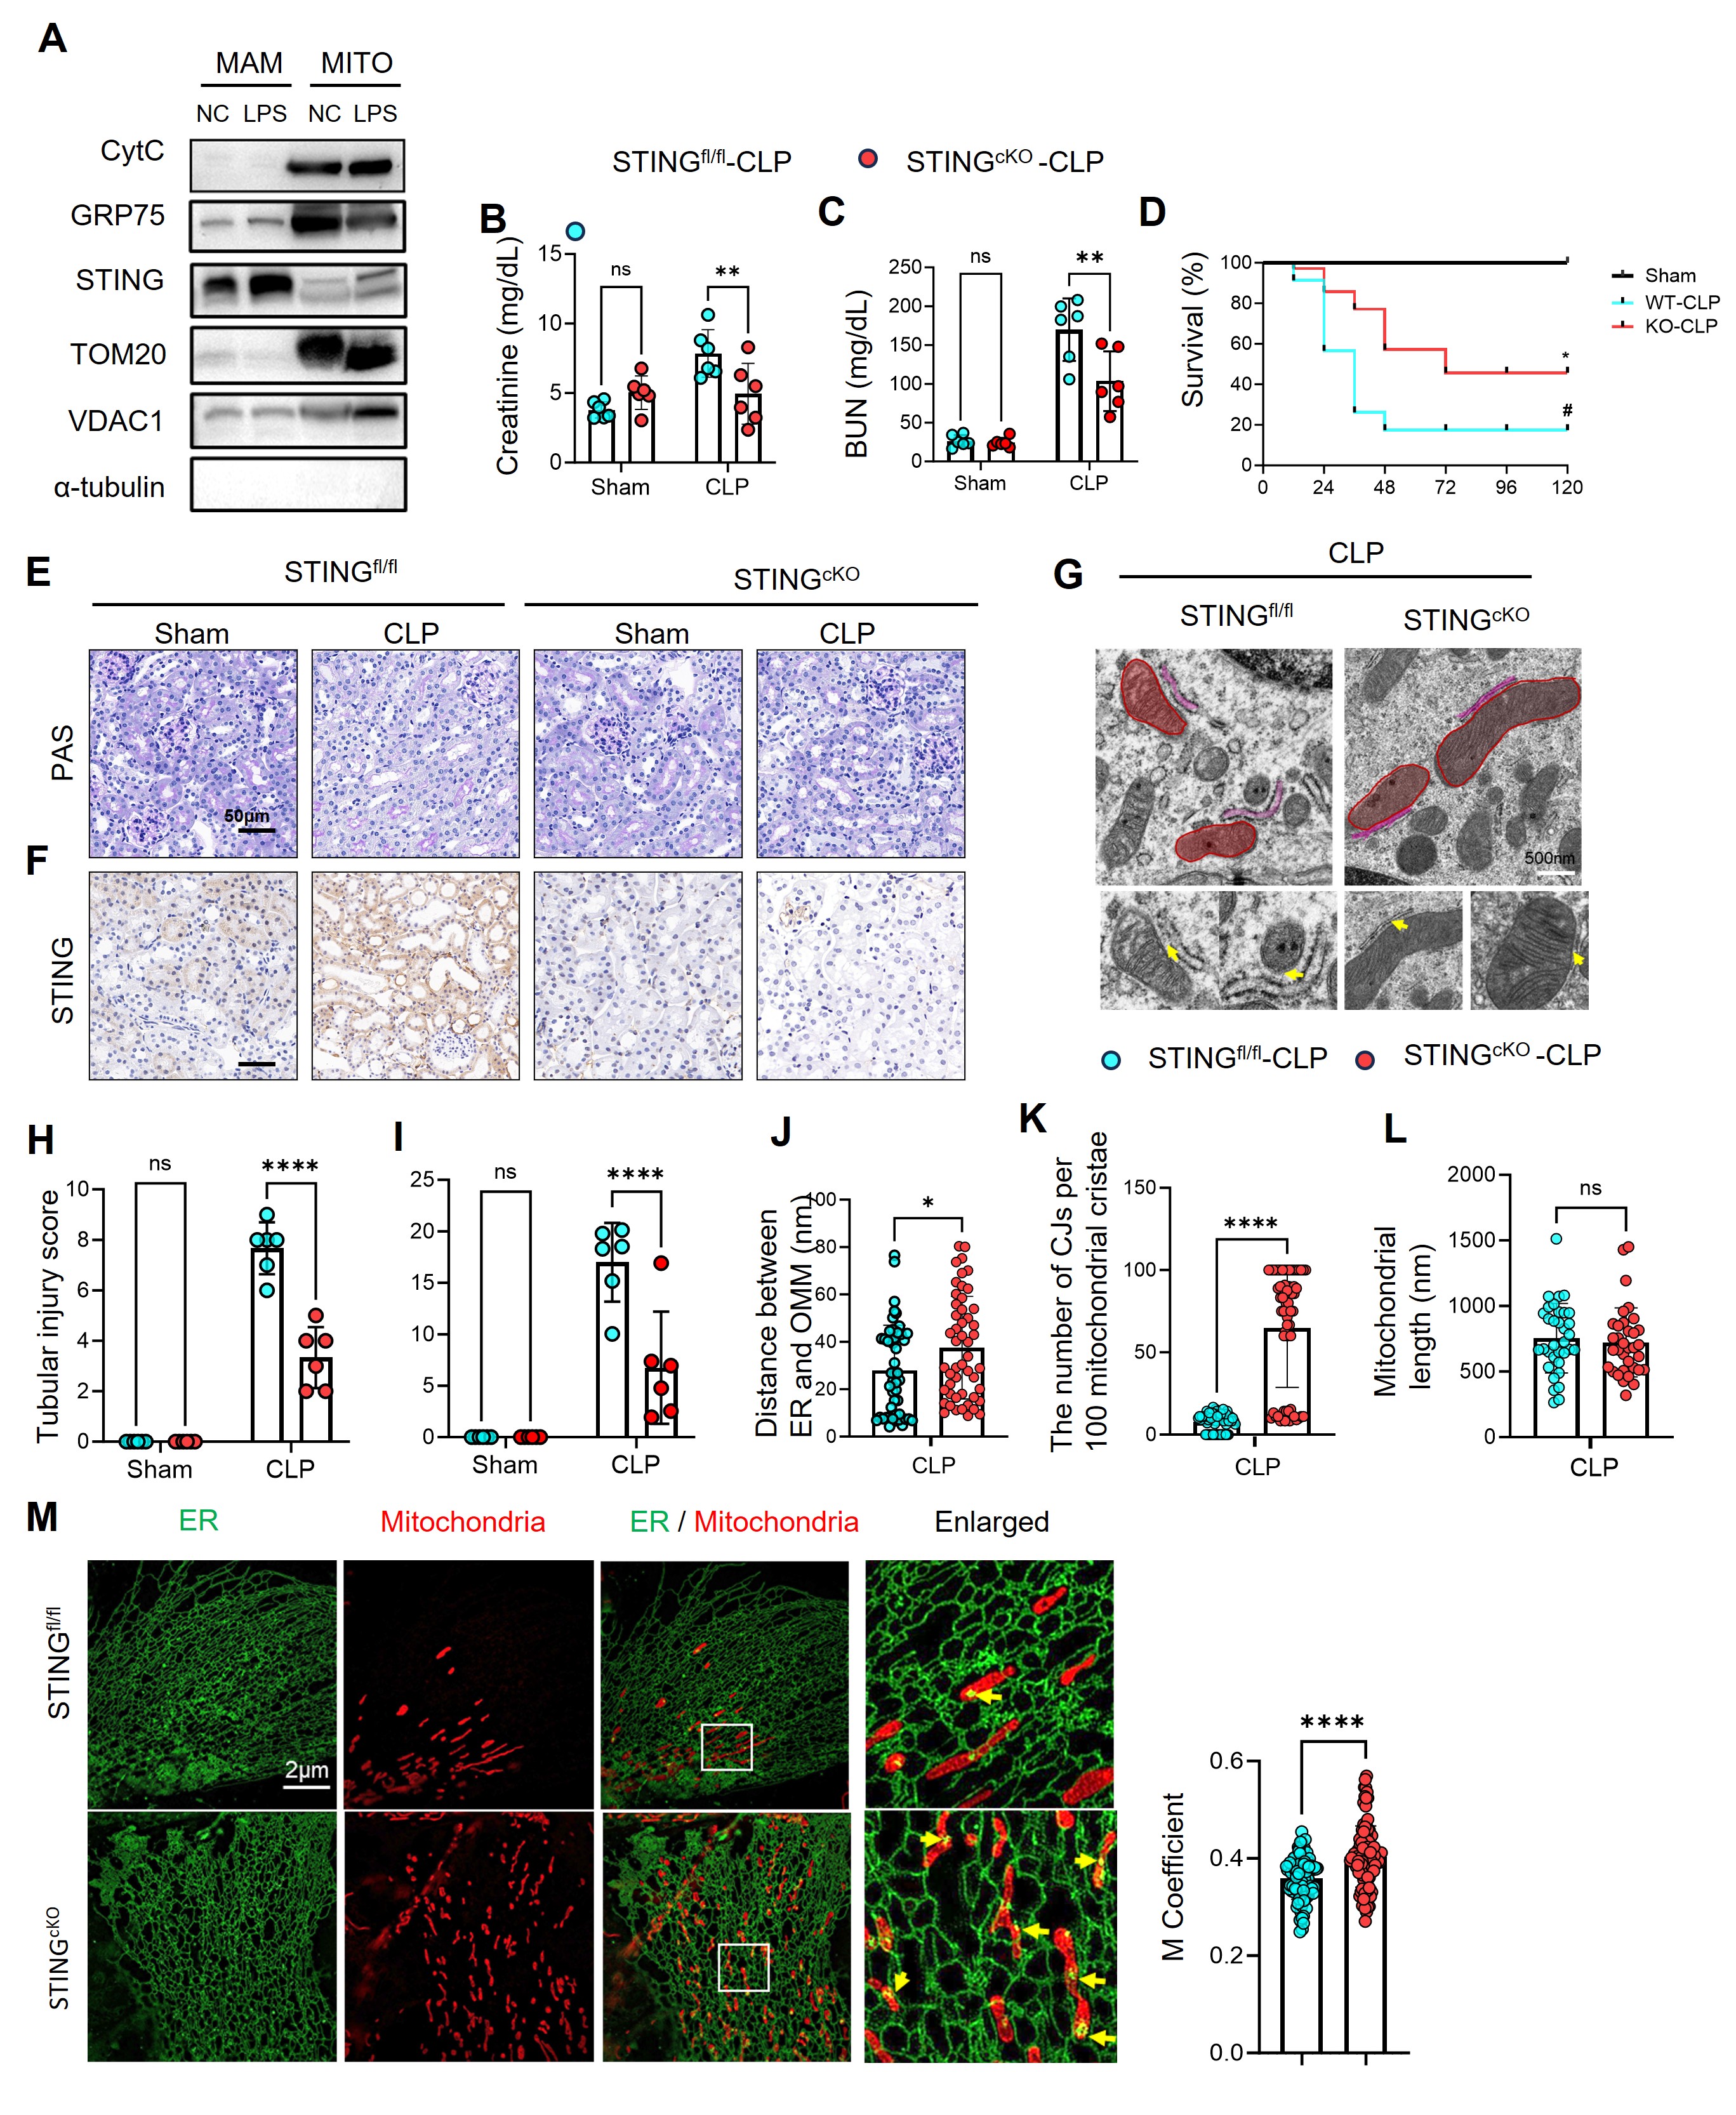
(A) Western blot analysis of subcellular fractions from mouse renal tubular cells showing STING enrichment in mitochondria-associated membranes (MAMs) and mitochondria (MITO) after LPS stimulation. GRP75 and TOM20 were used as MAM and mitochondrial markers, respectively.↳
(B–C) Serum creatinine and blood urea nitrogen (BUN) levels in STING^fl/fl and STING^CKO mice subjected to CLP or sham surgery (n = 6 per group).
(D) Kaplan–Meier survival curves demonstrating improved survival of STING^CKO mice compared with STING^fl/fl controls following CLP (n = 10 per group, log-rank test).
(E–F) Representative PAS and STING immunohistochemical staining of kidney sections from STING^fl/fl and STING^CKO mice 24 h after CLP, showing reduced tubular damage and attenuated STING expression in knockout mice.
(G) Transmission electron microscopy (TEM) images showing preserved mitochondrial cristae and reduced ER swelling in STING^CKO kidneys; yellow arrows indicate ER–mitochondria contact sites (MAMs). Red pseudocolor highlights mitochondria.
(H–I) Quantification of tubular injury scores and STING-positive area in renal tissues (n = 6).
(J–L) Quantitative ultrastructural analysis showing decreased ER–outer mitochondrial membrane (OMM) distance, increased number of crista junctions (CJs), and restored mitochondrial morphology in STING^CKO kidneys (n = 40–50 mitochondria per group).
(M) HIS-SIM super-resolution imaging of ER (green) and mitochondria (red) in primary tubular epithelial cells from STING^fl/fl and STING^CKO mice. Merged and enlarged views show enhanced ER–mitochondrial overlap in STING-deficient cells. The right panel quantifies Manders’ colocalization coefficient, indicating restoration of MAM integrity in STING^KO cells (n = 50 cells).
Data are shown as mean ± SEM; ns, not significant; *p < 0.05, **p < 0.01, ****p < 0.0001 versus indicated controls (one-way ANOVA or t-test as appropriate). Scale bars: (E–F) 50 μm; (G) 500 nm; (M) 2 μm.
1. STING Activation Correlates with Renal Damage in S-AKI
In the CLP model, WT mice exhibited severe renal dysfunction, elevated serum creatinine and BUN, and marked tubular necrosis. Immunofluorescence revealed that STING expression was significantly increased in proximal tubular epithelial cells and colocalized with the injury marker KIM-1. In contrast, STING⁻/⁻ mice showed preserved tubular architecture, lower levels of inflammatory infiltration, and improved seven-day survival. These data indicate that STING activation aggravates tubular injury during sepsis.
2. STING Localizes to MAMs and Disrupts ER–Mitochondrial Communication
Subcellular fractionation confirmed STING enrichment in the MAM compartment, where it co-localized with GRP75 and VDAC1. HIS-SIM imaging demonstrated reduced ER–mitochondrial contact in septic WT cells, whereas STING knockout restored the continuity of MAMs. TEM revealed that loss of STING prevented mitochondrial swelling and preserved cristae integrity. Proteomic profiling further indicated that STING deletion upregulated proteins associated with oxidative phosphorylation and fatty acid oxidation, suggesting recovery of mitochondrial metabolic capacity.↳
3. STING–VDAC1 Interaction Drives Calcium Overload and Pyroptosis
Molecular docking predicted multiple hydrogen-bond interactions between STING and VDAC1, which were experimentally confirmed by Co-IP assays. Mutation of C91A, the palmitoylation site essential for STING membrane localization, disrupted this interaction, whereas mutation of the canonical signaling site (S36A) did not. Overexpression of STING induced excessive mitochondrial calcium accumulation, increased ROS production, and upregulation of pyroptotic markers including NLRP3 and cleaved GSDMD. Silencing of VDAC1 or calcium chelation abolished these effects. In vivo, STING⁻/⁻ mice exhibited significantly reduced mitochondrial calcium levels, lower ROS generation, and attenuated pyroptosis, confirming that STING–VDAC1 coupling mediates calcium-dependent cell death.
