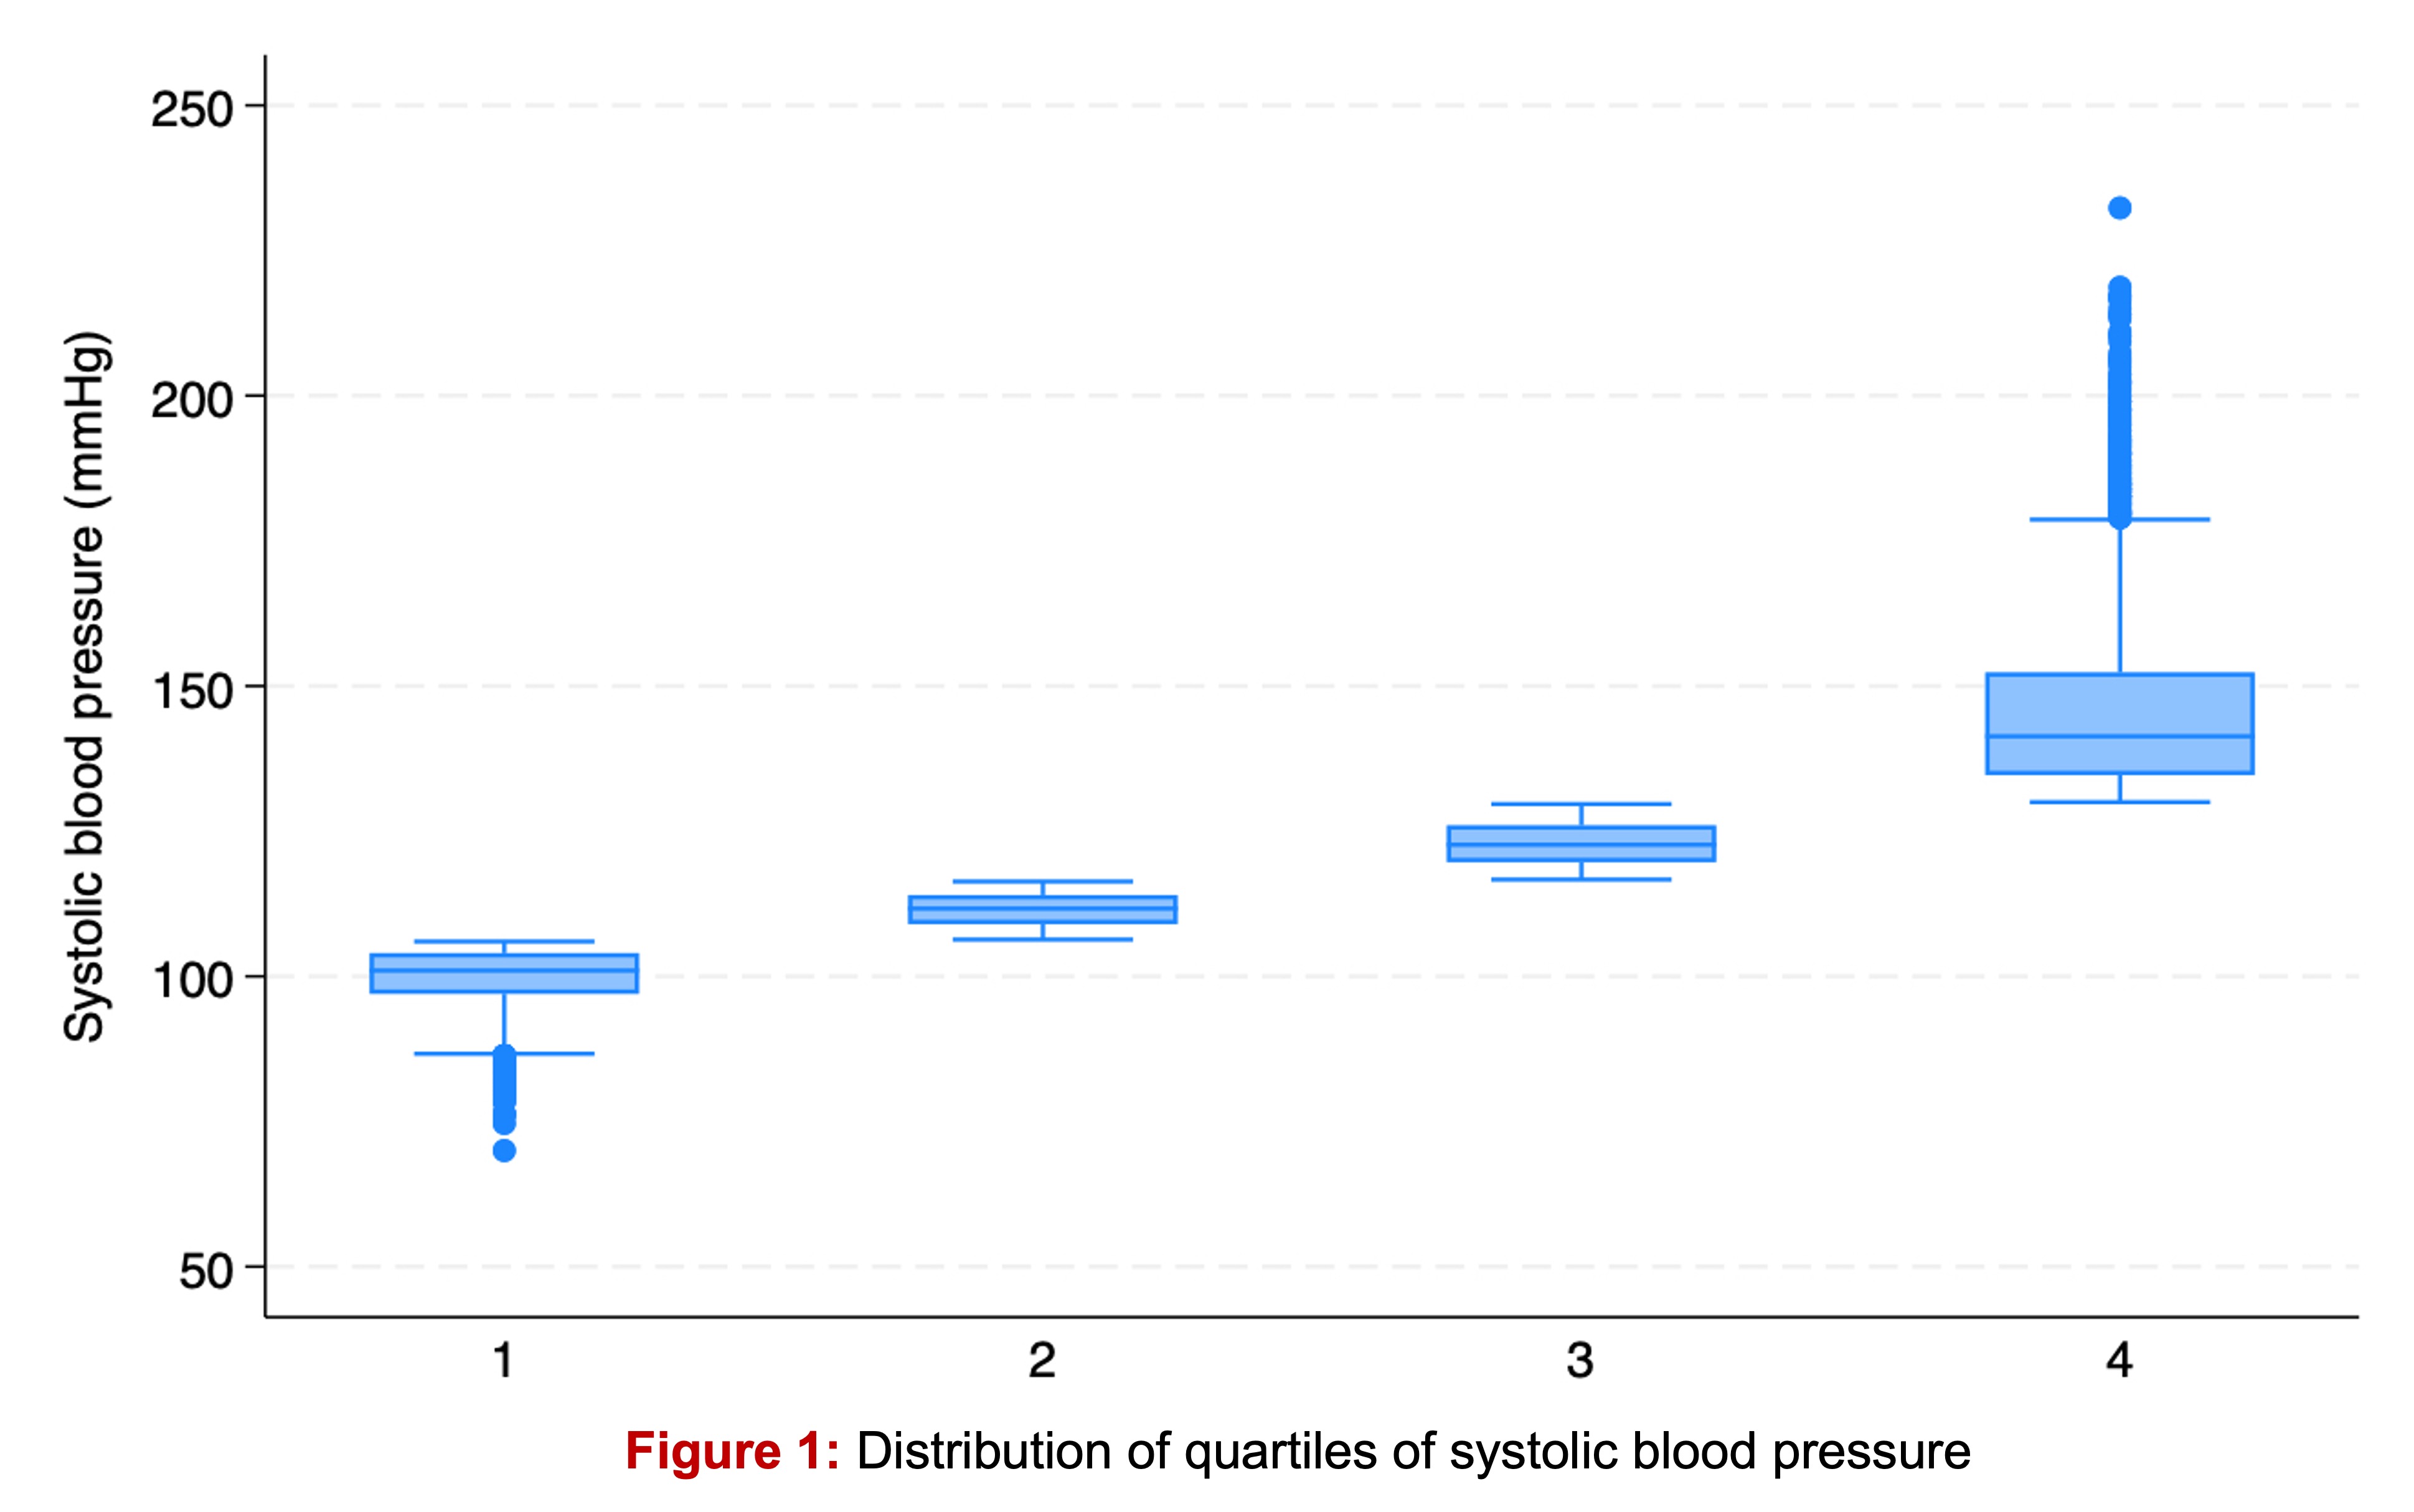
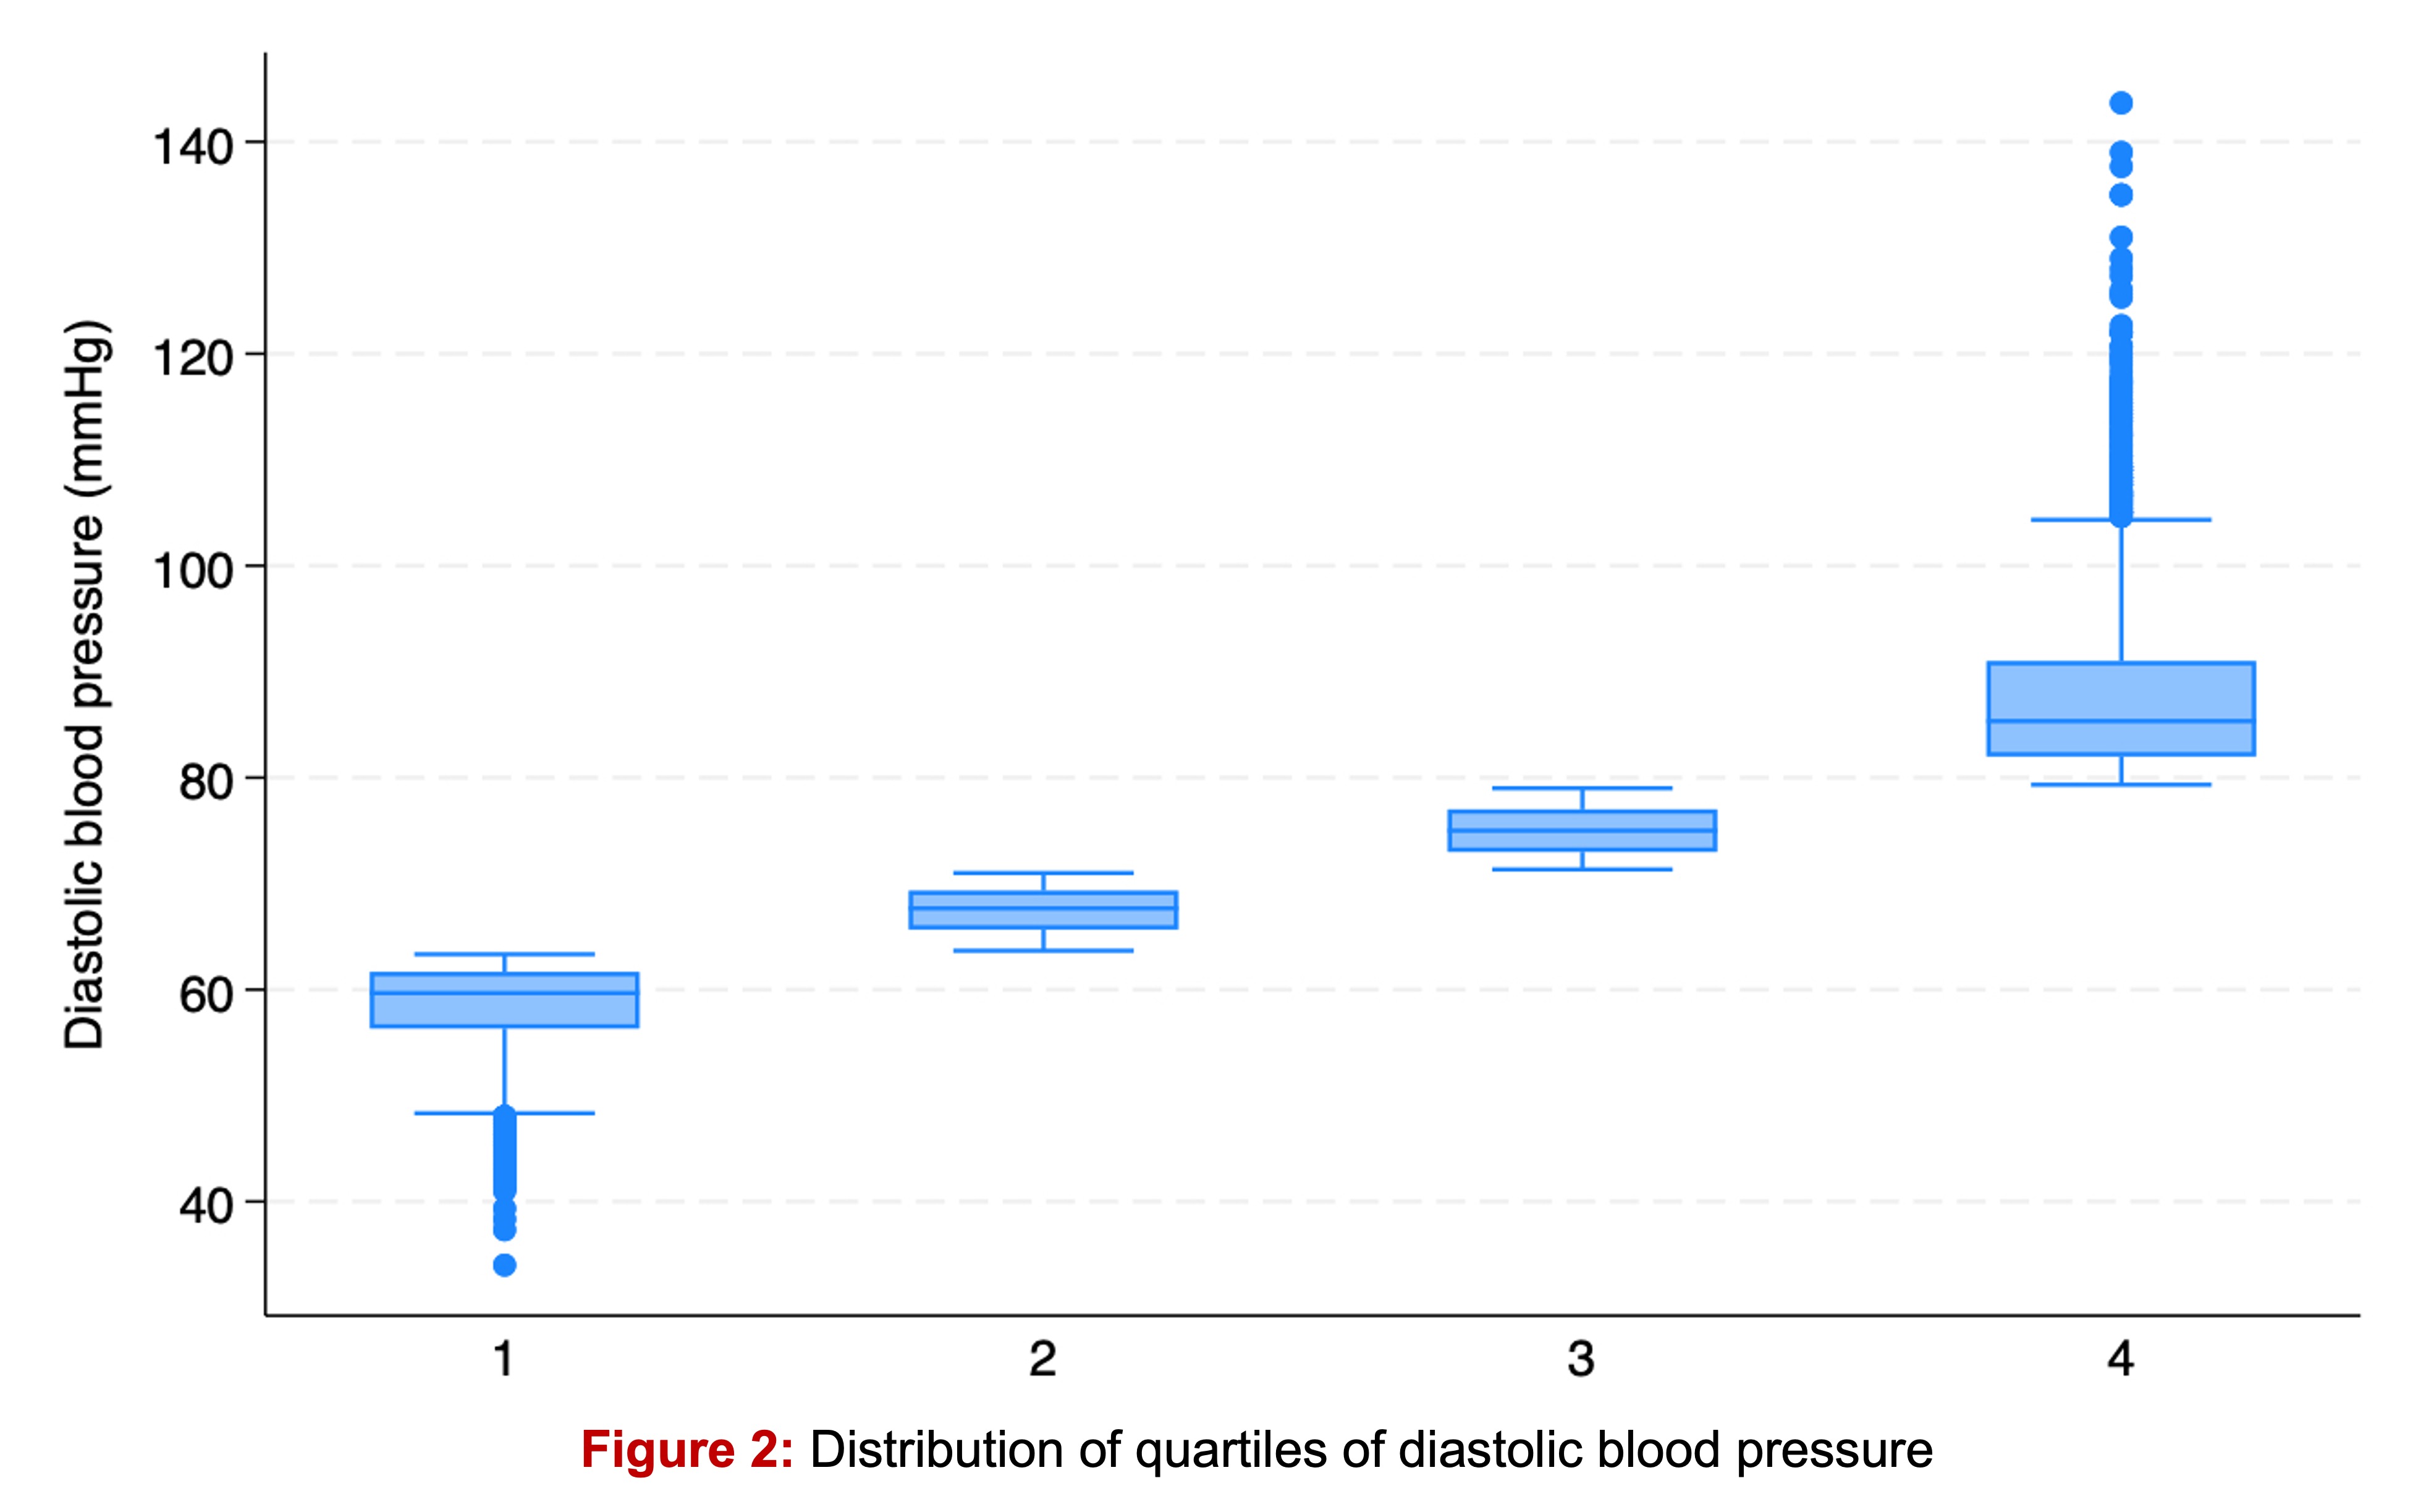
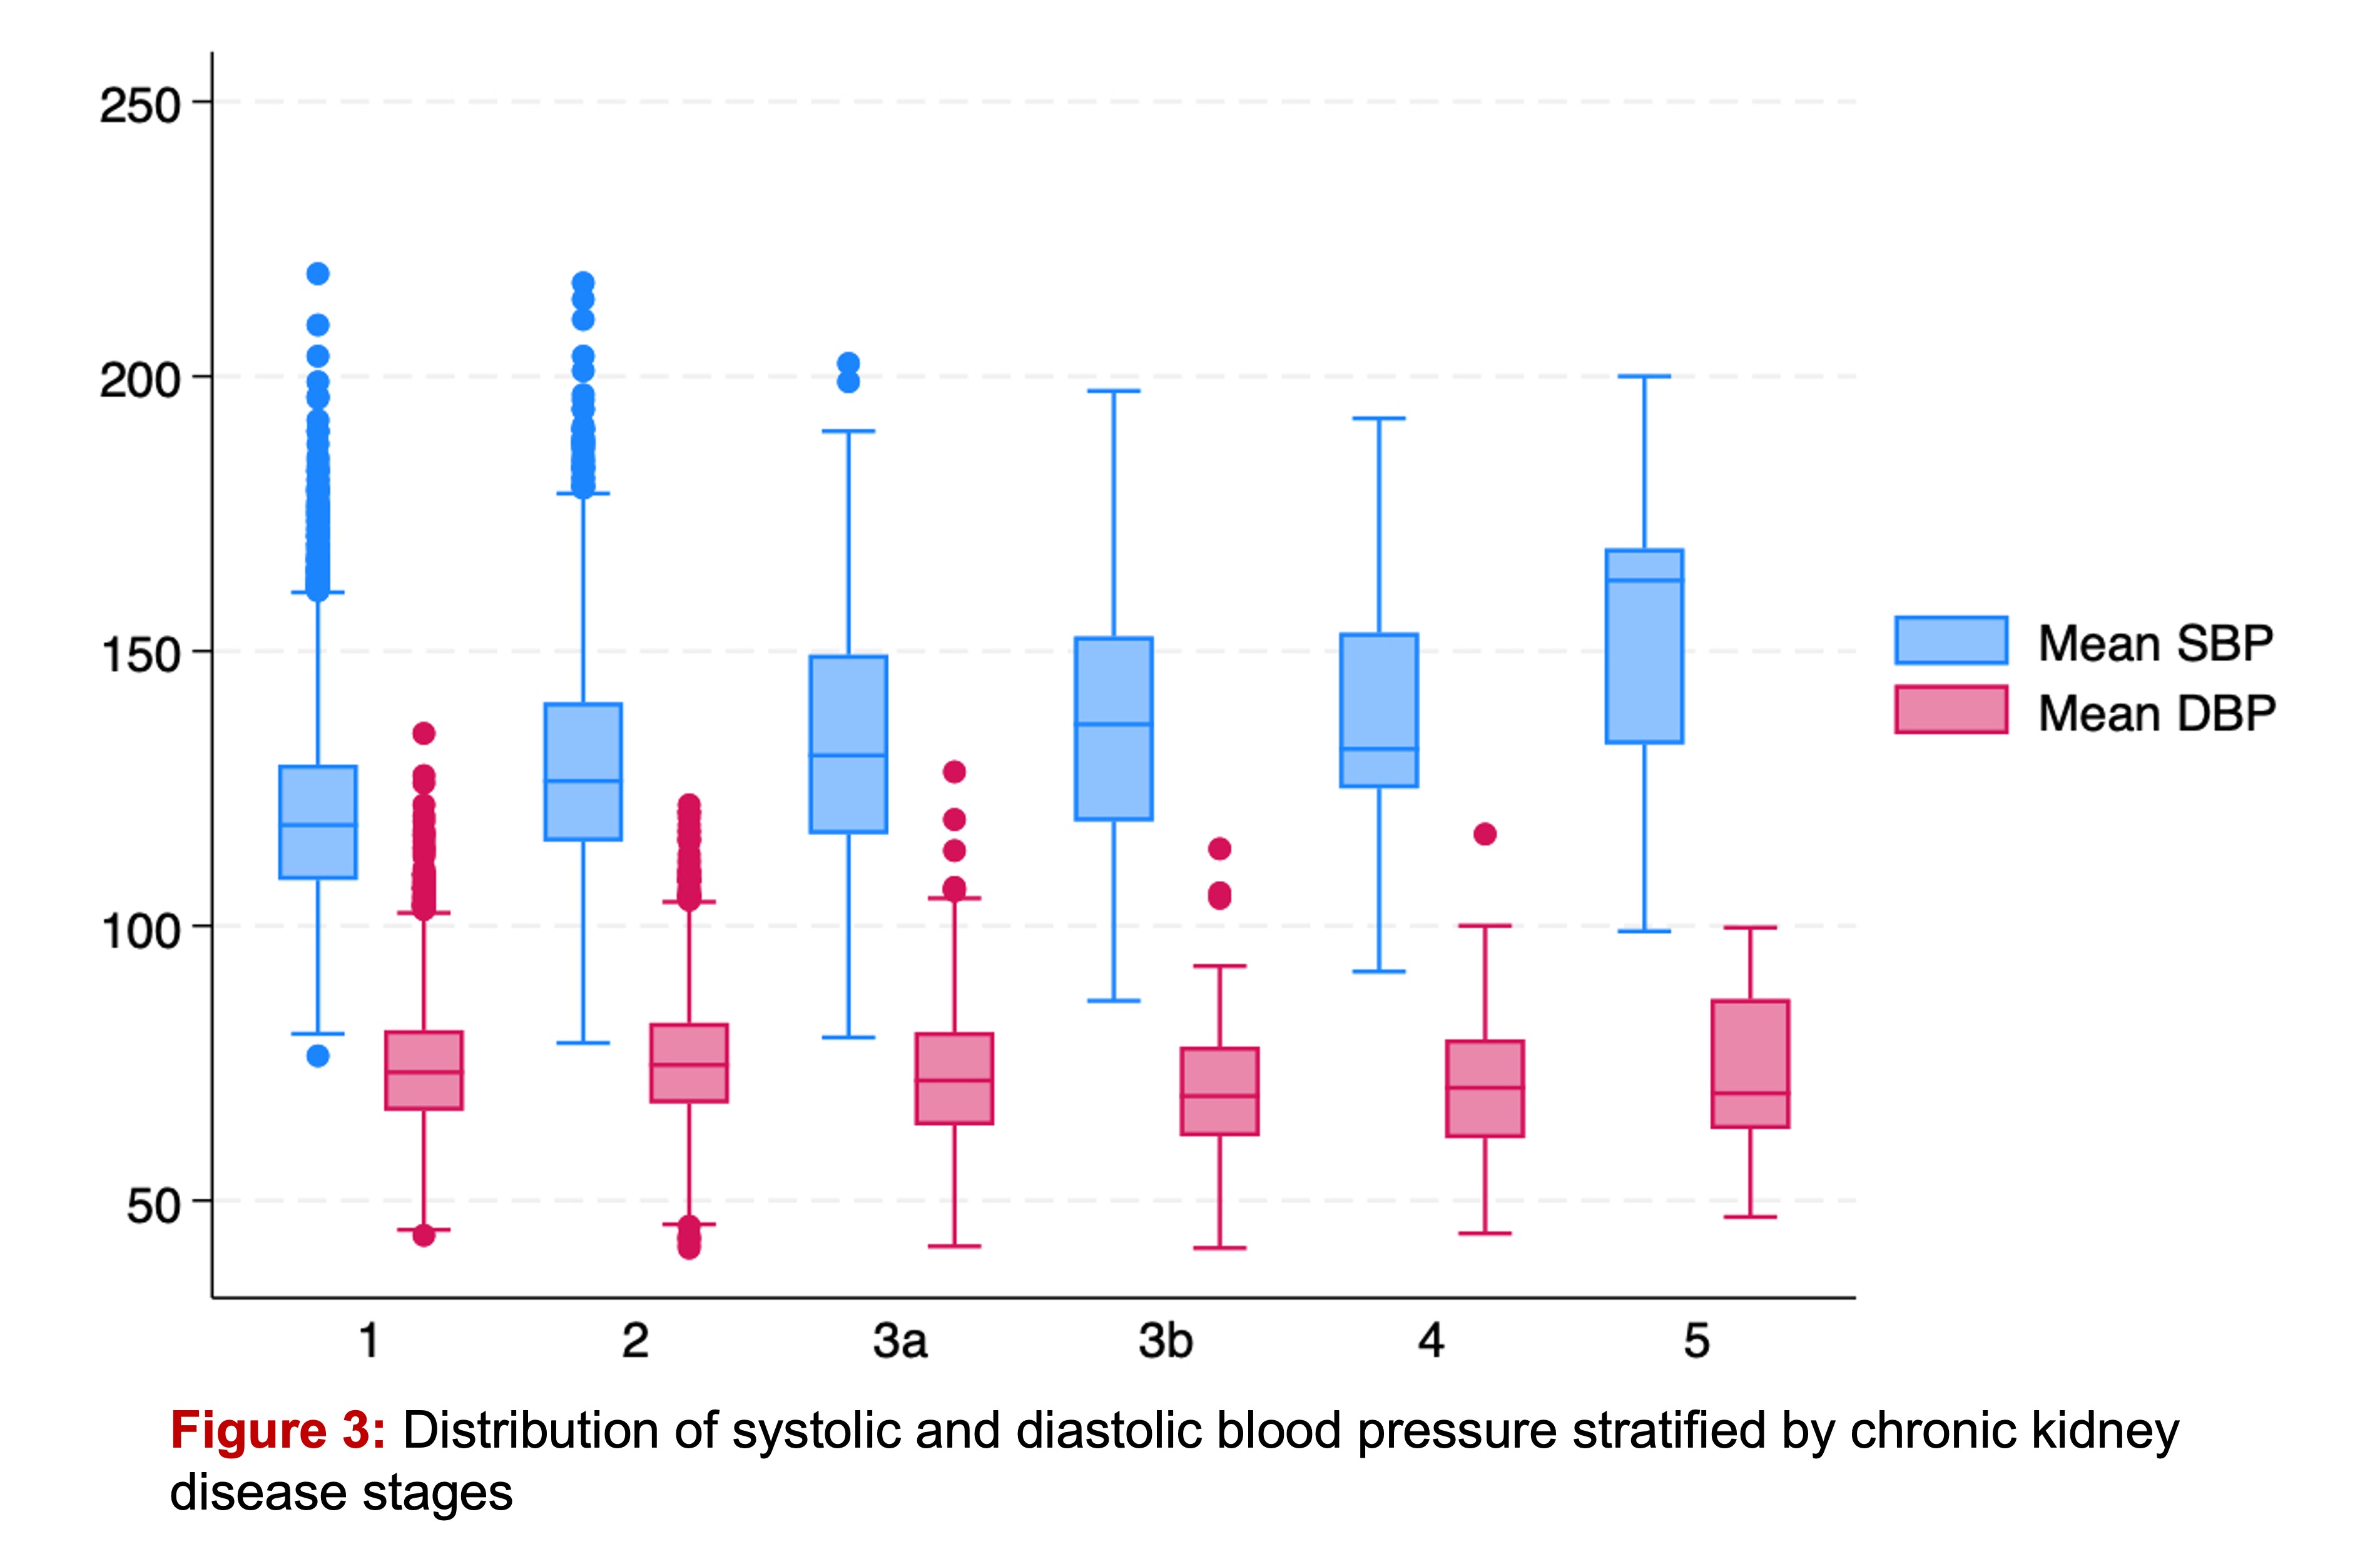
Of 17,846 adult participants ≥18 years old, the mean age+/-SD was 50.75804±18.62576 years and 53.07% were female. Mean SBP and DBP were 123.437±18.78356 and 74.3758±11.36866 mmHg, respectively. Median SBP (IQR) of Q1-Q4 were 101 (97, 104), 112 (109, 114), 123 (120, 126), and 141 (135, 152), respectively (Ptrend <0.0001, Figure 1). Median DBP (IQR) of Q1-Q4 were 60 (56, 62), 68 (56, 69), 75 (73, 77), and 85 (82, 91), respectively (Ptrend <0.0001) (Figure 2). Up to 36.63% and 13.99% ever been diagnosed with hypertension and diabetes, respectively. Participants with hypertension had significantly higher SBP and DBP compared to their non-hypertensive counterparts (SBP 132±20 vs. 119±16; mean±SEMdiff 14±0.31 mmHg and DBP 77±13 vs. 73±10, meandiff 5±0.26). Median eGFR was 98 mL/min/1.73 m2 (80, 112). Distribution of SBP and DBP stratified by CKD stages were shown in Figure 3. Compared to participants with Q1 of SBP, there was positively graded association of the odds of higher CKD stages versus the combined lower CKD stages in participants with Q2, 3, and 4 of SBP (ORSBP-Q2 1.289774, 95%CI 1.087535, 1.529623, P 0.003; ORSBP-Q3 1.784739, 95%CI 1.520853, 2.094413, P <0.0001; ORSBP-Q4 3.781916, 95%CI 3.238689 4.416259, P <0.0001). The association between Q of DBP and CKD stages was in the opposite direction and no significance (DBP: ORDBP-Q2 0.8669494, 95%CI 0.7484288, 1.004239, P 0.057; ORDBP-Q3 0.8761226, 95%CI 0.7592342, 1.011007, P 0.070; ORDBP-Q4 0.9685971, 95%CI 0.8428106, 1.113157, P 0.653). After adjusting for age, gender, race, ethnicity, body mass index, diabetes, hypertension, and hyperlipidemia status, HbA1c, mean SBP or DBP, total cholesterol, urinary microalbumin:urinary creatinine ratio, serum albumin, serum ferritin, high-sensitivity C-reactive protein, level of education, and the ratio of family income to poverty, the SBP quartile – CKD stage association were negatively graded association and significantly only in Q3 and 4 (aORSBP-Q2 0.8446179, 95%CI 0.6746448, 1.057415, P 0.141; aORSBP-Q3 0.722273, 95%CI 0.574752, 0.9076582, P 0.005; aORSBP-Q4 0.6059975, 95%CI 0.4671448, 0.7861224, P <0.0001). There were significantly lower the odds of worsening CKD stage only in Q4 of DBP in fully adjusted model (aORDBP-Q2 0.8544037, 95%CI 0.7004753, 1.042158, P 0.121; aORDBP-Q3 0. 8209054, 95%CI 0.6699415, 1.005887, P 0.057; aORDBP-Q4 0.771907, 95%CI 0.6140594, 0.9703302, P 0.027).
.
.
.
