Flow settings
The flow rates of bovine plasma
and blood were set at 30 mL/min in this study. In clinical practice, one
session of intermittent hemodialysis for children lasts less than 6 h. The
initial blood flow rate is 3 mL/kg per min, which is eventually increased to 5
mL/kg per min. When the body weight of the child is 10 kg, the blood flow rate is
set to 30 mL/min. In the present study, the flow rate setting mimicked the
conditions in the most severe cases encountered in clinical practice. The blood
recirculation flow rate was set at 170 mL/min using pump P2 (Figure 1B), which achieved
a rate of 200 mL/min to the hemofilter.
Test samples and anticoagulants
Bovine plasma was purchased from Funakoshi Co. Ltd. (Tokyo,
Japan). The quality control criterion was a protein concentration of 6.5 ± 0.5 g/dL.
After starting hemodiafiltration, heparin was injected for 1 h at a rate of 500
U/h upstream of chamber A to prevent clotting (Figure 1A and B). Bovine blood samples were purchased
from Funakoshi Co. Ltd. The quality control criteria were a protein concentration of 6.5 ± 0.5 g/dL and hematocrit of 35% to 40%. The blood also included 10,000
U of sodium heparin. The temperature of the samples was maintained at 37 °C using a hot
bath, which was mixed continuously with a magnetic stirrer. To prevent coagulation, 10% sodium
citrate was injected at a rate of 40 mL/h upstream of chamber A (Figure 1A and B).
Calculation of the transmembrane pressure and sample collection
TMP was recorded and 10-mL blood samples were collected 10 min, 1
h, 2 h, 3 h and 4 h after starting hemodiafiltration. A video monitor was used to
record the TMP for 60 s at each time point, and the average TMP was calculated
using values recorded every 1 s during the 60-s period. Four hemodiafiltration trials
were performed. Continuous hemodiafiltration with blood
recirculation (CHDF-R) using bovine blood were performed five times. Experiments with bovine plasma were performed using a polysulfone hemofilter (SHG-1.0; Toray Medical Company Ltd.) with
a membrane area of 1.0 m^2 and maximum allowable pressure of 500 mmHg. Experiments with bovine blood were conducted
using a polymethyl methacrylate hemofilter (CH-0.6W; Toray Medical Company
Ltd., Chiba, Japan) with a 0.6-m^2 membrane area and maximum allowable pressure of 500
mmHg. The rate of dialysate flow and
filtration flow was set at 7 mL/min. A 1-L container mimicked the body,
and samples were dialyzed by drawing blood from and returning
the blood to the same container. The
concentration obtained
by ultrafiltration at 170 mL/h was corrected with an equivalent amount of
saline to ensure that the total volume of the container was constant. CHDF and CHDF-R were performed under the same conditions, and 10-mL blood samples were
collected from the sampling ports upstream of chamber A (Figure 1A and B),
frozen, and stored at -80 °C until assays were performed.
Electron microscopy
A scanning electron microscope
(Gemini®; Carl Zeiss Co. Ltd., Tokyo, Japan) was used to examine the
surface of the hemofilter membranes after hemodiafiltration with blood plasma.
The hollow fiber membranes were sampled 5 cm from the inlet. The membranes were
dehydrated using an ethanol series consisting of 5 min each in 20%, 50%, 80%,
90%, and 100% ethanol. After drying, the membranes were frozen in liquid nitrogen. The areas where clogging was observed
on the electron micrographs were quantified using ImageJ software (National
Institutes of Health, Bethesda, MD, USA).
Coagulation analysis
The contact system is believed to be the main trigger for the
coagulation cascade during extracorporeal circulation. We therefore, measured levels of D-dimer, thrombin-antithrombin
III complex (TAT), and plasmin-alpha 2 plasmin inhibitor complex (PIC) to estimate the effects of CHDF-R
on coagulation. D-dimer levels
were measured using a latex photometric immunoassay with CP3000 (Sekisui Medical
Corporation, Tokyo, Japan). TAT levels were measured using a time-resolved
fluoroimmunoassay with a STACIA automatic coagulation analyzer (LSI Medience
Corporation, Tokyo, Japan). And PIC levels were measured using a latex
photometric immunoassay with a STACIA automatic coagulation analyzer (LSI
Medience Corporation).
Hemolysis analysis
Hemoglobin (Hb) levels were measured using the sodium lauryl
sulphate-Hb detection method with a XN-9000 instrument (Sysmex Corporation, Hyogo, Japan). Lactate dehydrogenase levels were
measured using the International Federation of Clinical Chemistry and
Laboratory Medicine method with a Toshiba 2000FR analyzer (Toshiba Medical
System Corporation, Tokyo, Japan). Total bilirubin levels were measured using
the bilirubin oxidase method with a Toshiba 2000FR analyzer (Toshiba Medical
System Corporation).
Statistical analysis
Statistical
analyses were performed using EZR statistical
software version 1.55 (Saitama Medical Center, Jichi Medical University,
Saitama, Japan). The TMP, D-dimer, Hb, lactate dehydrogenase, total bilirubin,
and Kt/V values for CHDF and CHDF-R were compared using the Mann-Whitney U test.
Statistical significance was set at p
< 0.05.
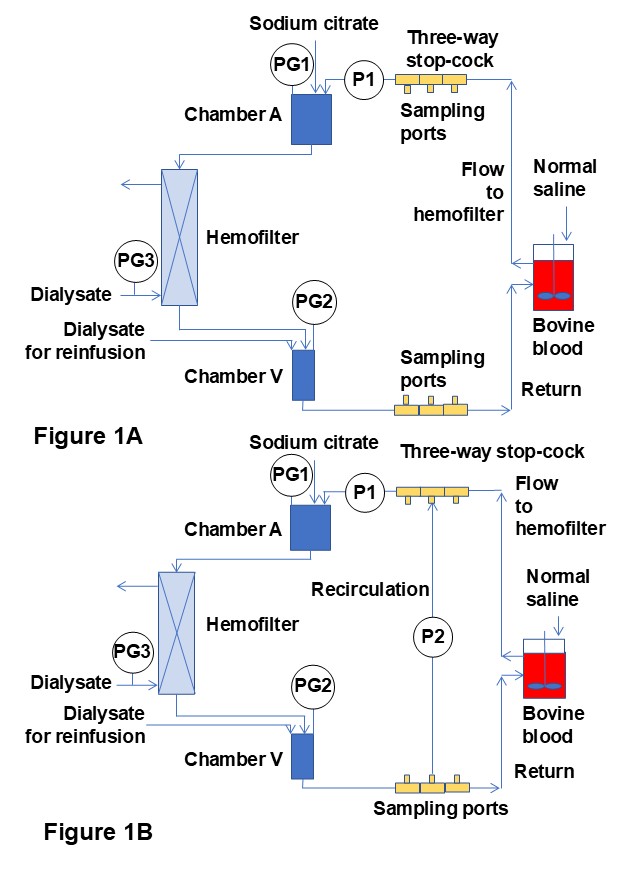
FIGURE LEGENDS
Figure 1: Hemodiafiltration circuits. (A) Standard circuit (continuous hemodiafiltration, CHDF). (B) Novel blood recirculation circuit (continuous hemodiafiltration with blood recirculation, CHDF-R). P, pump; PG, pressure gauge. The ultrafiltration rate was 170 mL/h. Sodium citrate (10%) was injected at a rate of 40 mL/h upstream of chamber A. To maintain the same total volume in the container, the flow rate of normal saline was set at 130 mL/h.
