KLOTHO-DERIVED PEPTIDE 1 PROTECTS AGAINST ACUTE KIDNEY INJURY BY DIRECTLY TARGETING MITOCHONDRIAL ATAD3A


Certificate Output Instructions

For best output, select "Paper Size" as "A4" and "Margin" as "0" or "None".

To save or print to PDF, please select Print Destination > Save as PDF, enable Background Graphics under "More Settings", then click "Save".


Certificate Background


Presented the abstract " "
(Abstract co-author(s):  )


E-Poster Presentation

During the congress, E-Posters will be accessible to all participants on the congress website 24/7, as well as in the E-poster stations in the congress center. 

Preparing your E-Poster

Please review the E-Poster format requirements carefully when preparing your E-Poster. Should your E-Poster not meet the mentioned requirements, it may not be displayed as described above.

​E-Poster Submission Deadline

Please prepare and upload your E-Poster no later than March 14, 2026 11.59PM CET. After this date, you will no longer be able to prepare and upload your E-poster and it will not be displayed and accessible on the congress website.​

E-Poster Format Requirements
  • PDF file
  • Layout: Portrait (vertical orientation)
  • One page only (Dim A4: 210 x 297mm or PPT)
  • E-Poster can be prepared in PowerPoint (one (1) PowerPoint slide) but must be saved and submitted as PDF file.
  • File Size: Maximum file size is 2 Megabytes (2 MB)
  • No hyperlinks, animated images, animations, and slide transitions
  • Language: English
  • Include your abstract number
  • E-posters can include QR codes, tables and photos
https://storage.unitedwebnetwork.com/files/1099/1c76b7a831157c1fcae74094ad281409.pdf
KLOTHO-DERIVED PEPTIDE 1 PROTECTS AGAINST ACUTE KIDNEY INJURY BY DIRECTLY TARGETING MITOCHONDRIAL ATAD3A

Please follow the instructions below to input your abstract title.

Abstract titles should be brief and reflect the content of the abstract.

  • The title will not be accepted if it exceeds 25 words.
  • Type in CAPITAL LETTERS.
  • Lowercase may be used for abbreviations only, for example, mRNA.
Xiaoyao
Zhang
Xiaoyao Zhang 799012440@qq.com Nanfang Hospital, Southern Medical University State Key Laboratory of Multi-organ Injury Prevention and Treatment, National Clinical Research Center for Kidney Disease, Division of Nephrology Guangzhou China *
Youhua Liu liuyh@smu.edu.cn Nanfang Hospital, Southern Medical University State Key Laboratory of Multi-organ Injury Prevention and Treatment, National Clinical Research Center for Kidney Disease, Division of Nephrology Guangzhou China -


Acute kidney injury (AKI) is a clinical syndrome with sudden renal function decline, diagnosed via elevated serum creatinine and/or oliguria, afflicting 10-50% of hospitalized patients. It triggers multiple organ dysfunction and raises chronic kidney disease (CKD) risk, with aging increasing incidence 3-8-fold and worsening CKD progression. Currently, no therapies accelerate AKI recovery, with management focusing on prevention, early detection and secondary injury mitigation.

Therapeutic limitations stem from incomplete understanding of AKI pathogenesis, where altered renal hemodynamics, inflammation, oxidative stress and tubular cell death converge on mitochondrial dysfunction. This impairs energy metabolism, perpetuates inflammation and tubular cell death, caused by ultrastructural lesions (e.g., cristae fragmentation), loss of regulators (e.g., OPA1, Sam50) and functional impairments (e.g., respiratory chain dysfunction), making mitochondrial protection a potential AKI treatment strategy.

The anti-aging protein Klotho, abundant in kidney tubular cells, exerts renoprotection by suppressing senescence and apoptosis, with its expression inversely linked to AKI. Exogenous Klotho alleviates AKI, possibly via preserving mitochondria, but its mitochondrial protection mechanism is unclear. Klotho replacement is limited by its large size, structural complexity and high cost to produce, so we developed Klotho-derived peptide 1 (KP1), which recapitulates Klotho’s renoprotection via TβR2 binding, though KP1’s effect on AKI mitochondrial integrity is unknown.

In this study, we investigated the protective potential of KP1 in AKI, focusing on its effect on mitochondrial dysfunction.  We found that KP1 can enter into tubular cells via endocytosis and directly binds to mitochondrial ATPase family AAA-domain-containing protein 3A (ATAD3A), thereby stabilizing mitochondrial architecture to preserve renal function.  Our findings not only establish KP1 as a promising therapeutic candidate for AKI, but also reveal a novel mitochondria-targeted strategy for kidney protection. 

Peptide synthesis

KP1, FITC-KP1, and KP1 alanine mutants (GenScript, >95% purity) were dissolved at a concentration of 15 µM.


Animal models and KP1 treatment

Male C57BL/6 mice (6–8 weeks) were randomly assigned to groups (n=6/group). IRI: Bilateral renal arteries were clamped (29 min, 37.5°C), and the mice were euthanized 1 day post-reperfusion. CDDP: cisplatin (20 mg/kg) was administered intraperitoneally to mice, and samples collected 72 h later. KP1 (5 mg/kg/day) was administered 2 days pre-IRI/CDDP.


Cell culture and treatment

HKC-8 cells (16–24 h serum starvation) were pretreated 1 h with KP1/KP1-mutant (3 µM), PCZ (15 µM), FITC, or FITC-KP1 (3 µM) before H/R or CDDP treatment. H/R: 1% O₂, 24 h; 20% O₂, 4–6 h. CDDP: 7 µg/mL for 24 h.


Mouse primary proximal tubular epithelial cells

Kidney cortex was minced, digested (collagenase Ⅳ), sieved, and filtered (70 µm). Percoll gradient centrifuged (35%/45%). Cells were cultured in DMEM/F-12 (10% FBS, penicillin-streptomycin) to 60–80% confluency (4–8 days) and characterized by E-cadherin⁺/vimentin⁻  staining (purity ~95%).


Western blot

Proteins from kidney tissues or HKC-8 were separated using SDS-PAGE, transferred to PVDF, blocked with 5% milk, incubated with antibodies, and then visualized by chemiluminescence detection reagents. 


RT-qPCR

RNA was extracted using TRIzol, reverse-transcribed to cDNA, and quantitatively analyzed using SYBR Green PCR Master Mix.


Cell transfection

ATAD3A/HIGD2A siRNAs and plasmids were transfected into HKC-8 (Lipofectamine 2000).


Hydrodynamics-based genes transfer in vivo 

The expression plasmids were prepared using QIAfilter Plasmid Midi and Maxi Kits and injected intravenously  (2.5 mg/kg, 2 mL saline) 2 days pre-IRI/CDDP. 


Co-Immunoprecipitation

Using protein A/G PLUS-agarose to capture proteins, and detecting them by either Western blot analysis or high-throughput mass spectrometry.


Histology and IHC/IF staining

PAS staining was performed to evaluate renal tubular injury, while TUNEL was employed to quantify the degree of apoptosis.

IHC: Sections were incubuted with primary antibodies (4°C, overnight) and secondary antibodies, and then developed with AEC. 

IF: Sections wrer incubuted with primary and fluorescent secondary antibodies, counterstained with DAPI, and imaged under a confocal microscope.


Flow Cytometry

Samples were analyzed using a BD Biosciences flow cytometer.  Apoptosis rates were quantified using PE Annexin V Apoptosis Detection Kit I.


MST

Prepared GFP-ATAD3A-transfected lysates. KP1 was serially diluted two-fold from 200 µM (16 concentrations) and mixed with equal volumes of lysate.  Samples were analyzed on a Monolith NT.115 instrument for dissociation constant (Kd) determination.


DARTS 

Prepared ATAD3A-overexpressing lysates. KP1 (0/25/100 µM) was incubated with equal volumes of lysate (5 µg/µL) for 30 min.  Resultant complexes were digested with Pronase at enzyme/mixture ratios of 1:100, 1:500, and 1:1000 (10 min, RT).  Proteolytic fragments were analyzed by Western blot or LC-MS/MS.


Mitochondrial Isolation and quantitative proteomics study

Mitochondria were isolated from tissues and cells using a mitochondrial isolation kit. The proteomic analysis was carried out by Cosmos Wisdom Corporation. Bioinformatics analyses included protein annotation, functional enrichment, and protein-protein interaction.


Transmission electron microscopy and immunogold electron microscopy

Samples were processed and imaged by electron microscopy at Huayin Medical Laboratory.  Immunogold labeling for FITC-KP1 was carried out by specific anti-FITC antibody.


Stimulated emission depletion (STED) imaging

Cells were incubated with PK Mito Orange dye, followed by image acquisition using a STEDYCON microscope.


Label free live cell microscopy imaging

Cells were captured by label free live cell microscopy system (IDT channels). 


Longitudinal high-throughput live-cell analysis

Used caspase-3/7 green reagent to evaluate apoptosis dynamics on the Incucyte SX5 Live-Cell Analysis System, with phase-contrast and fluorescence images captured at 1.5-h intervals over 36 h under physiological conditions.


Detection of serum creatinine and blood urea nitrogen

Scr and BUN levels were determined by an automatic chemistry analyzer. 


Statistical analysis

All data were expressed as mean ± SEM (≥3 cell experiments; n=6 mice). Statistical analysis using GraphPad Prism 9.0.0 with t-tests for comparisons between 2 groups; one-way ANOVA for comparisons between multiple groups, followed by LSD/Dunnett tests.  P < 0.05 was considered significant.

KP1 protects against both nephrotoxic and ischemic AKI in mice

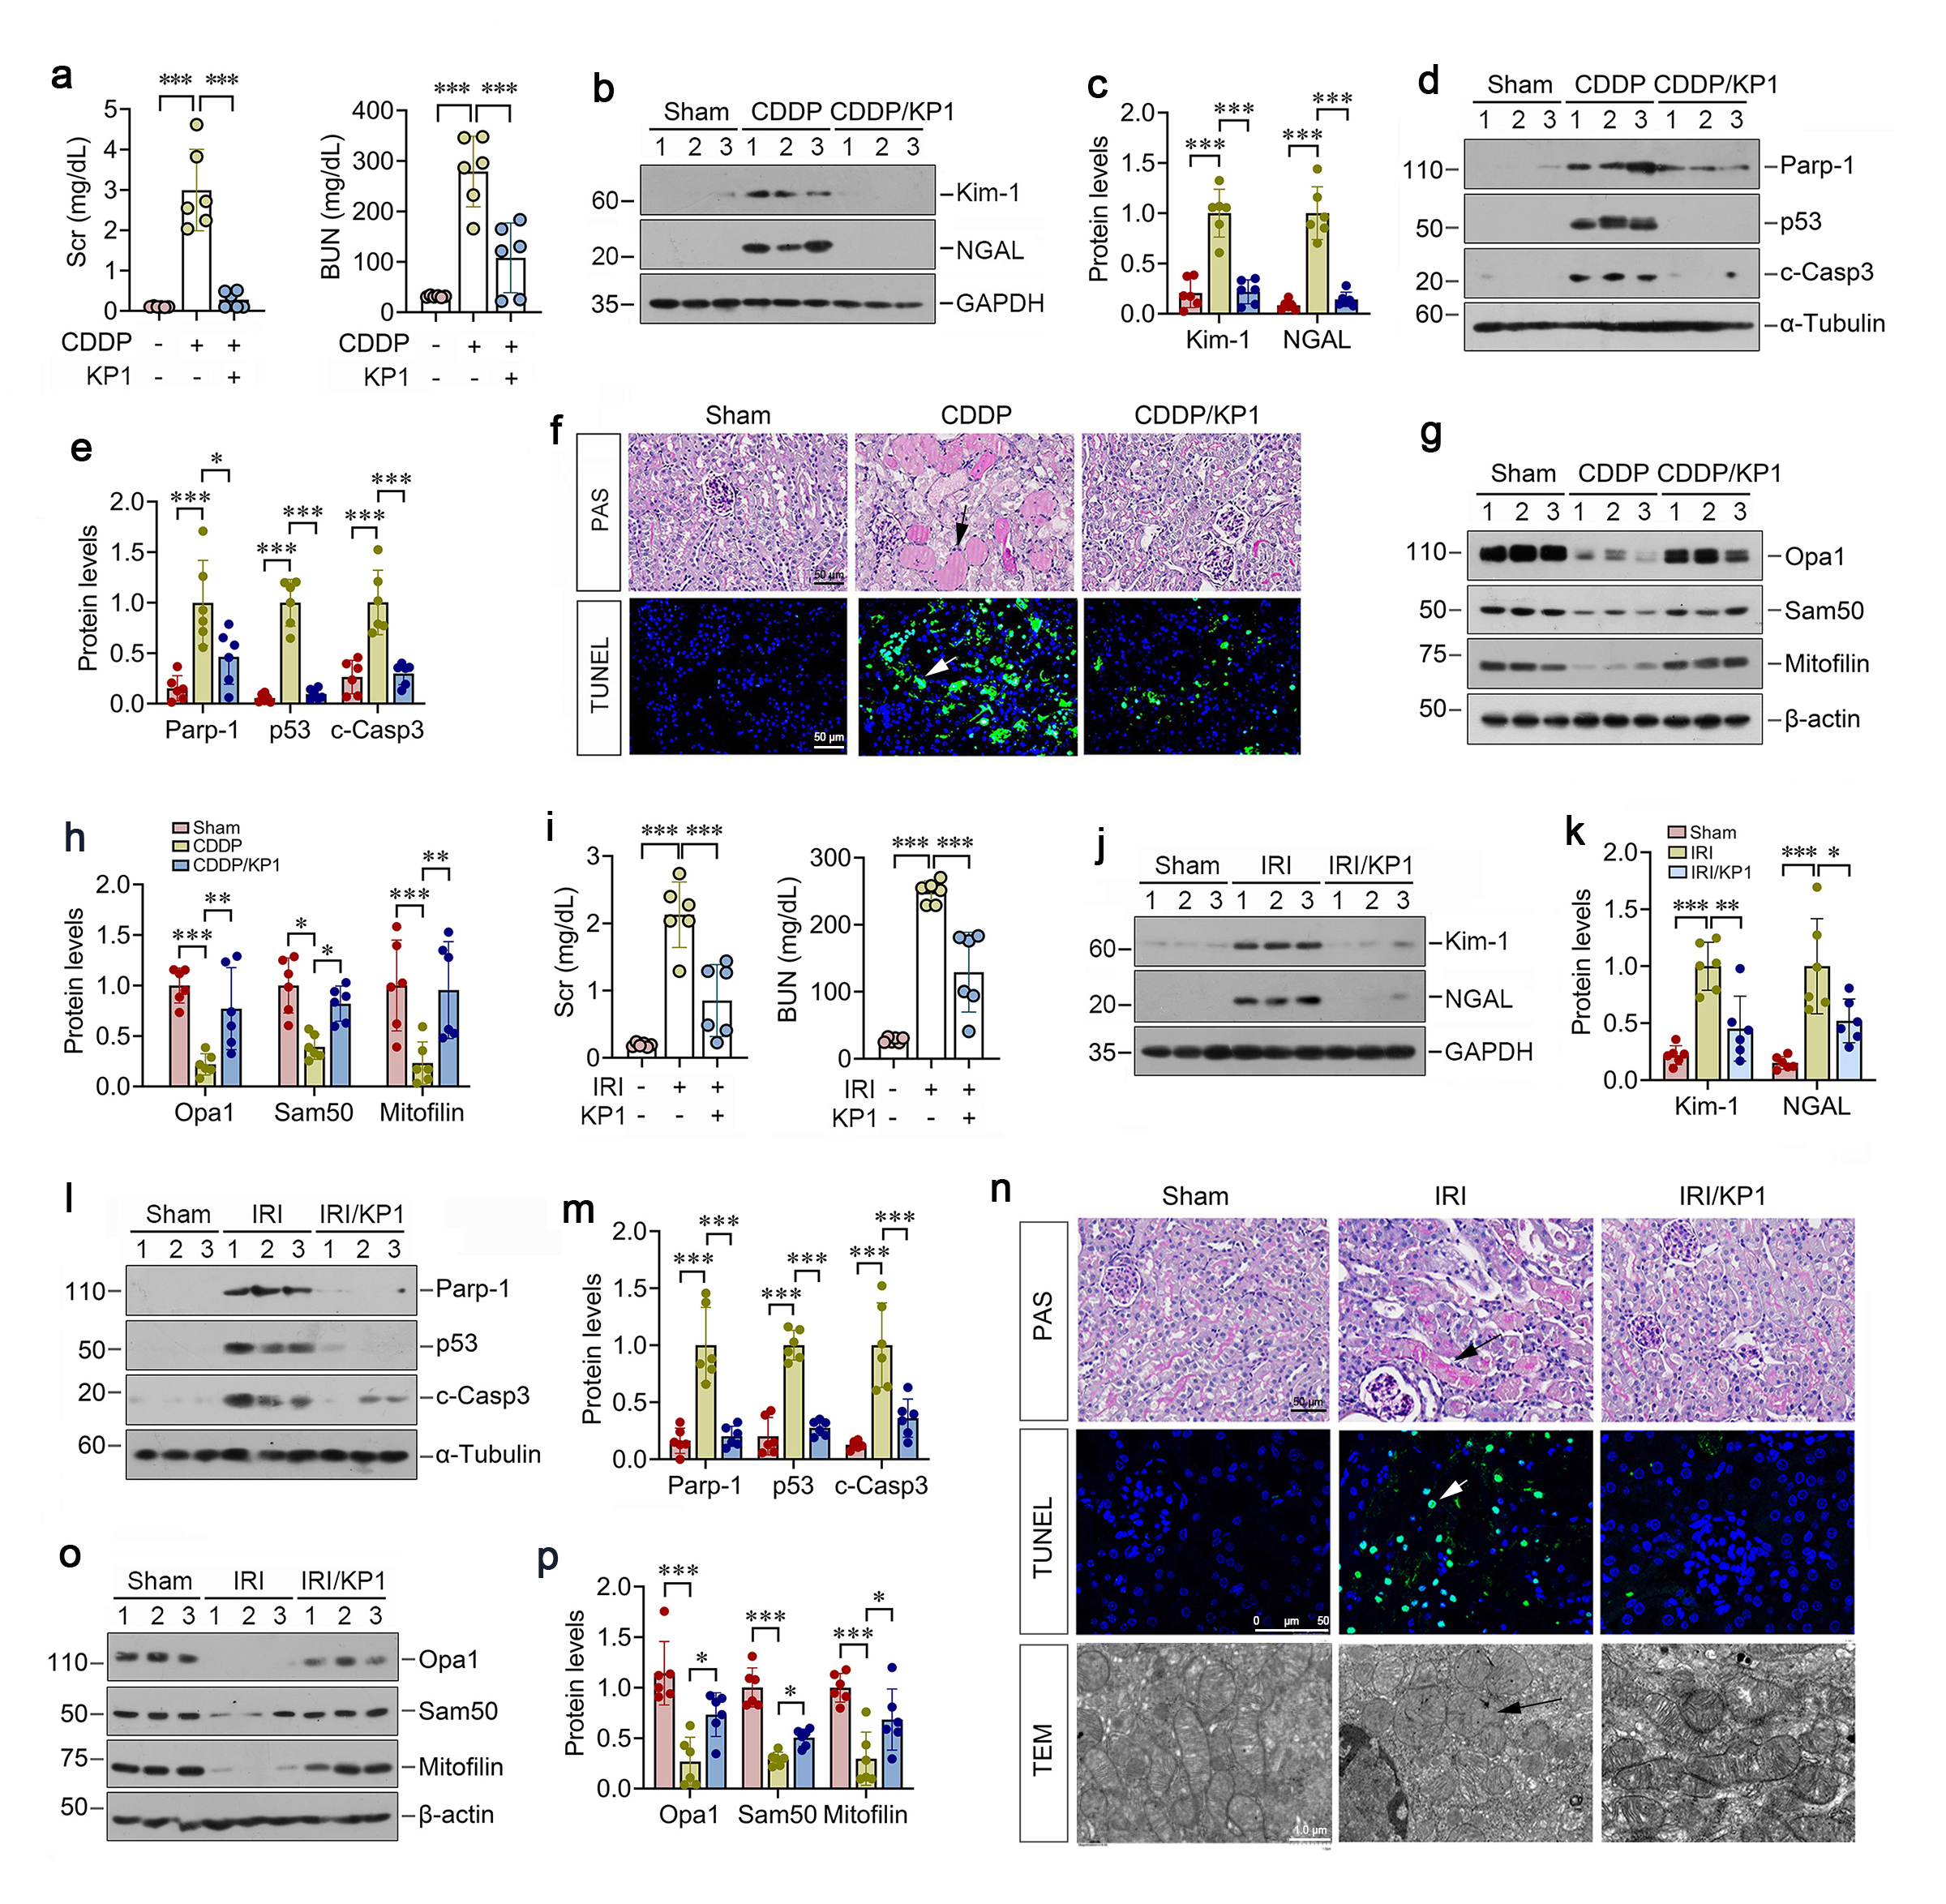
We first examined the potential role of KP1 in AKI induced by cisplatin (CDDP), a widely used nephrotoxic drug.  As shown in Figure 1a, Scr and BUN assays revealed that KP1 ameliorated CDDP-induced kidney dysfunction.  KP1 attenuated CDDP-induced upregulation of renal injury markers kidney injury molecule-1 (Kim-1) and neutrophil gelatinase-associated lipocalin (NGAL) (Figure 1b and c), apoptosis markers poly(ADP-ribose) polymerase 1 (PARP-1), p53, cleaved caspase-3 (Figure 1d and e).  Periodic acid-Schiff (PAS) staining revealed that KP1 prevented CDDP-induced pathohistological alterations, including tubular epithelial flattening, cell death, basement membrane rupture, tubular dilation, and prominent cast formation (Figure 1f).  TUNEL staining also demonstrated that KP1 largely abolished tubular cell apoptosis induced by CDDP in the kidneys (Figure 1f).  We found that CDDP-induced AKI was associated with depletion of mitochondrial proteins OPA1, Sam50, mitofilin, which were almost completely restored by KP1 (Figure 1g and h), suggesting a special role of KP1 in protecting against mitochondrial dysfunction in AKI.  

To generalize these findings, we employed ischemic AKI induced by bilateral ischemia/reperfusion injury (IRI).  As shown in Figure 1i, KP1 also reduced IRI-induced Scr and BUN levels.  KP1 abolished IRI-upregulated Kim-1, NGAL, PARP-1, p53, and cleaved caspase-3 (Figure 1j-m). Histologically, KP1 prevented IRI-induced pathological alterations and reduced apoptosis in kidney tubular epithelium (Figure 1n).  Notably, KP1 conferred mitochondrial protection by restoring IRI-depleted mitochondrial proteins OPA1, Sam50, and mitofilin (Fig. 1o and p).  Electron microscopy also confirmed that KP1 preserved the ultrastructural integrity of mitochondria in tubular cells.  KP1 reestablished healthy mitochondria with ordered cristae and elongated morphology by preventing IRI-induced fragmented and spherical transformation, membrane blurring, and cristae disorganization (Figure 1n).

 Figure 1. KP1 protects against both nephrotoxic and ischemic AKI in mice. (a) Graphic presentation shows the serum creatinine (Scr) and blood urea nitrogen (BUN) levels in CDDP mice after KP1 treatment. (b, c) Western blotting analysis for Kim-1 and NGAL protein levels in CDDP mice after KP1 treatment. (d, e) Western blotting analysis for Parp-1, p53 and c-Casp3 protein levels in CDDP mice after KP1 treatment. (f) Representative Acid-Schiff (PAS) and TUNEL staining micropraghs in CDDP mice after KP1 treatment. Scale bar, 50 µm. (g) Representative Western blot analyses of Opa1, Sam50 and mitofilin protein levels in IRI mice after KP1 treatment. (h) Quantitative data of Opa1, Sam50 and mitofilin protein levels in IRI mice after KP1 treatment. (i) Graphic presentation shows the Scr and BUN levels in IRI mice after KP1 treatment. (j, k) Western blotting analysis for Kim-1 and NGAL protein levels in IRI mice after KP1 treatment. (l, m) Western blotting analysis for Parp-1, p53 and c-Casp3 protein levels in IRI mic


KP1 prevents renal tubular injury and mitochondrial dysfunction in vitro

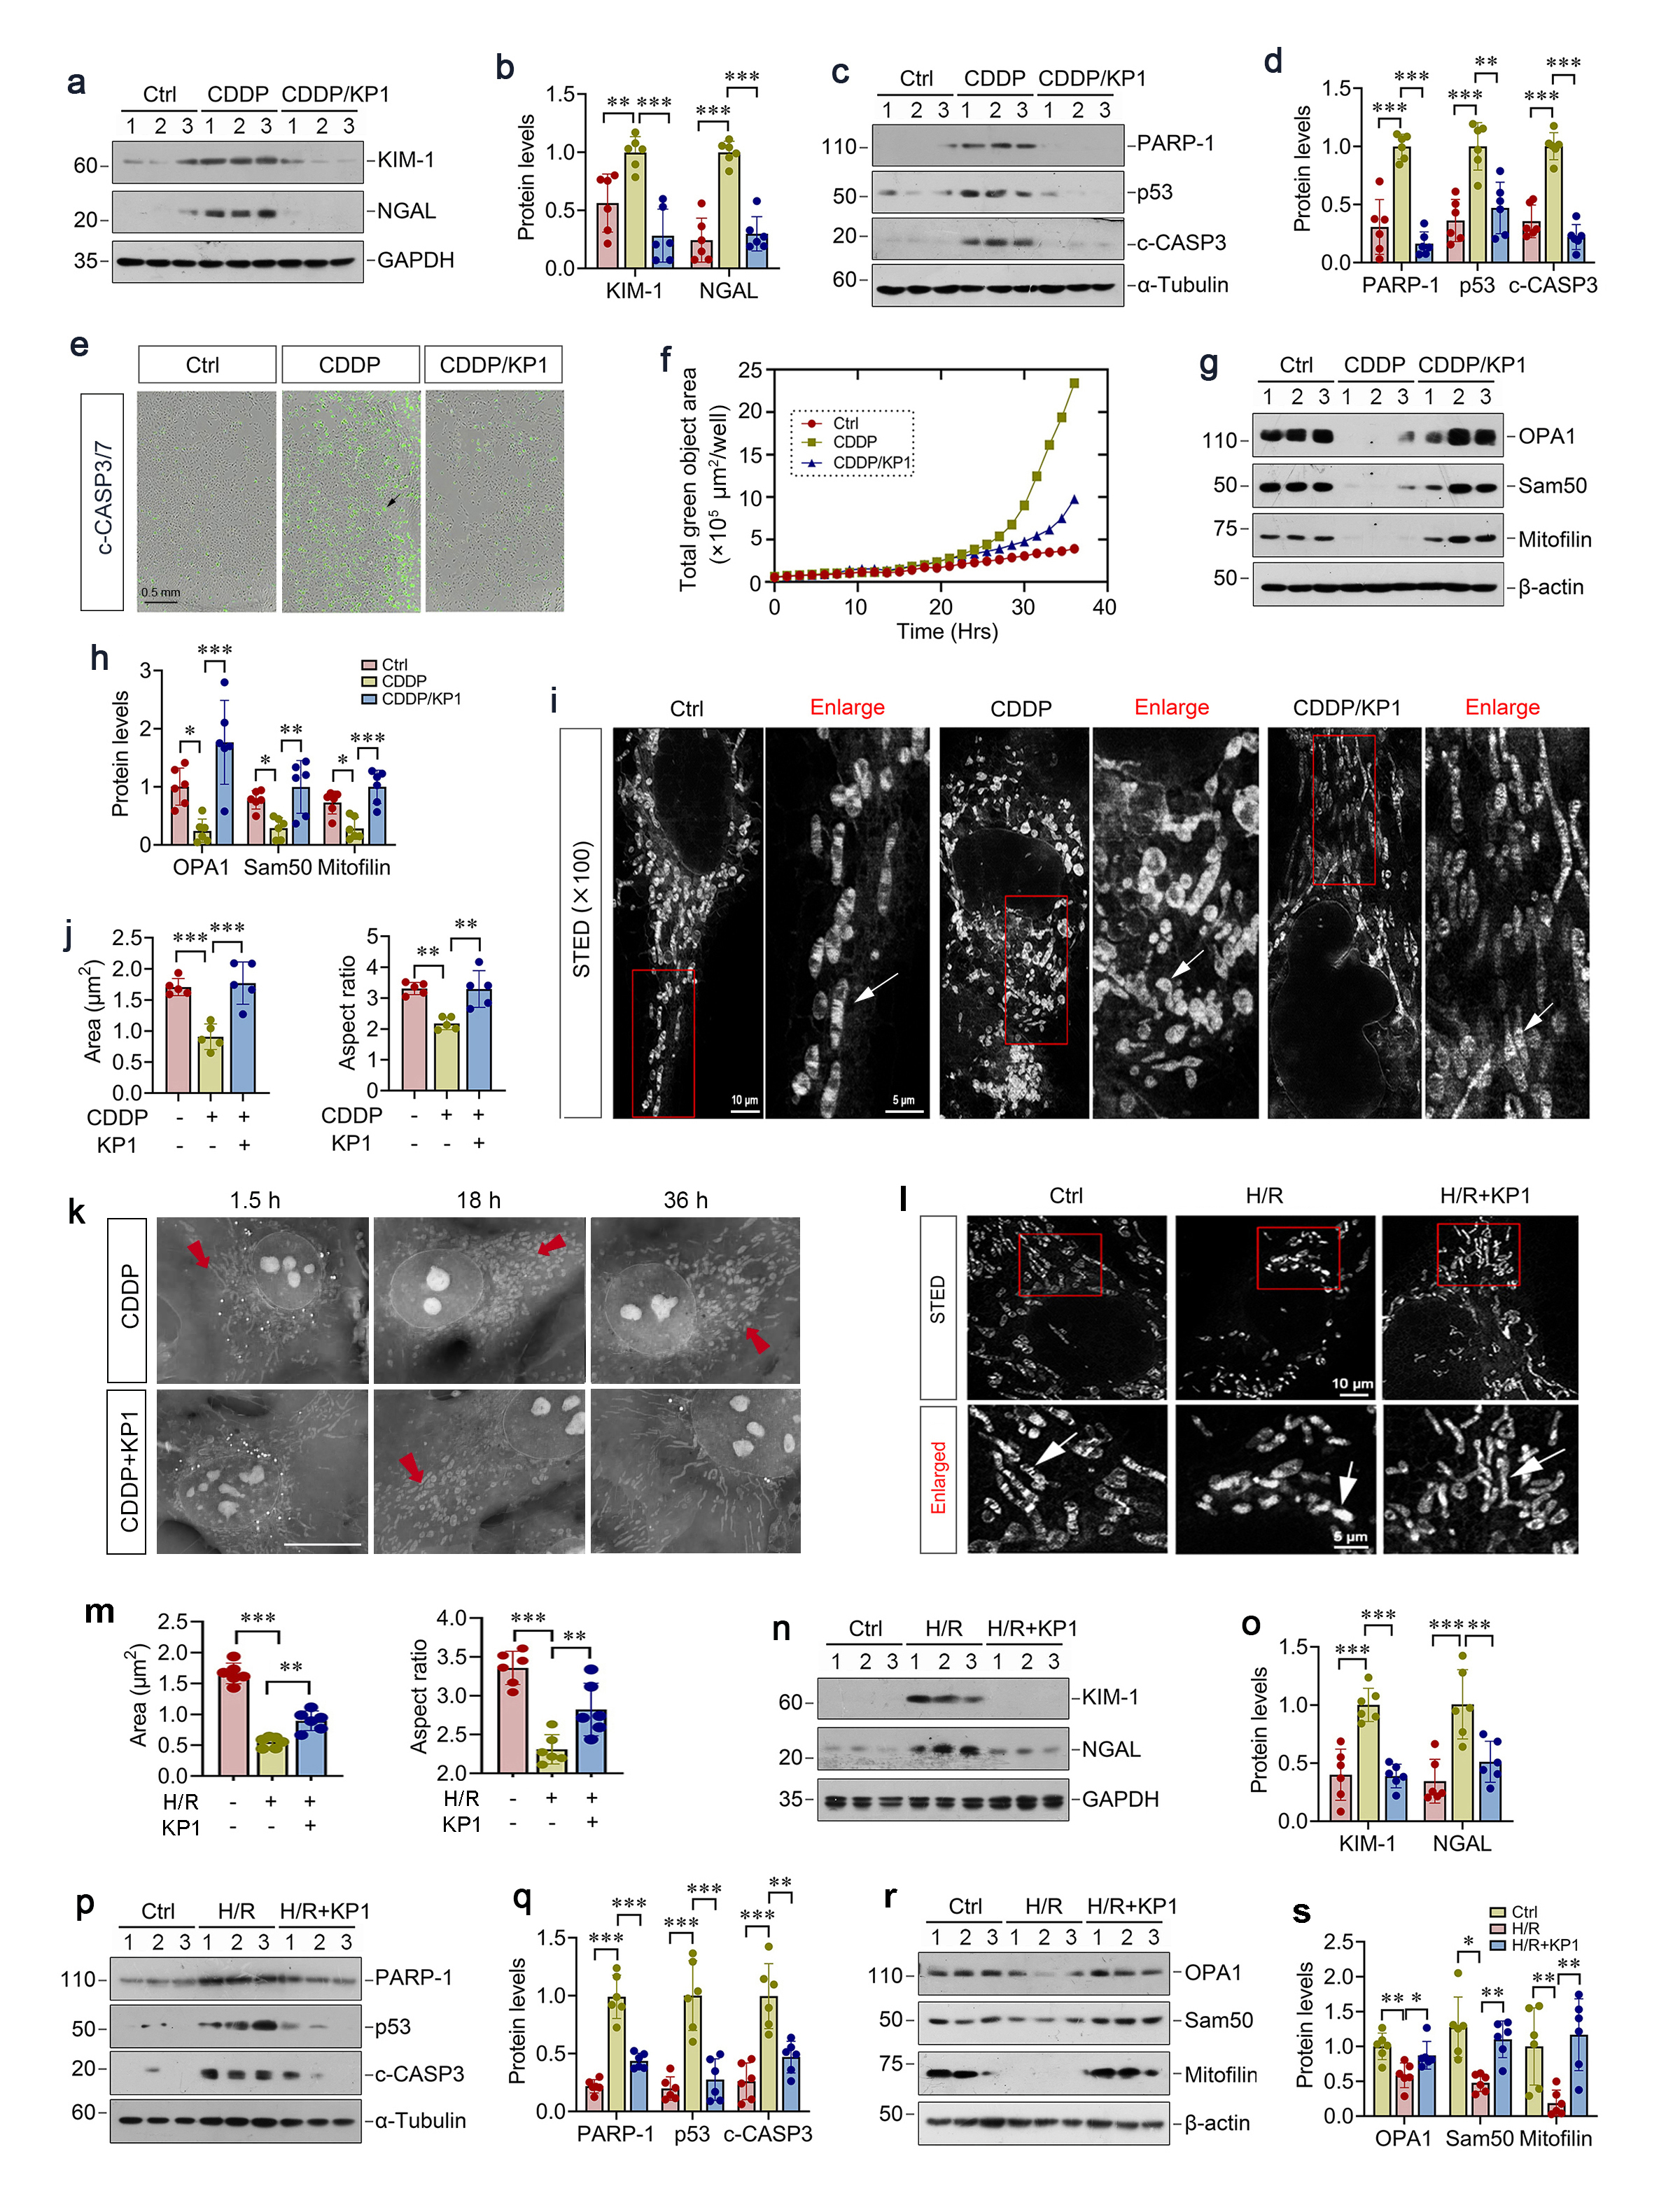
We next investigated the role of KP1 in protecting tubular cells against nephrotoxic and ischemic injury in vitro.  As shown in Figure 2a-d, CDDP induced the upregulation of tubular injury markers Kim-1 and NGAL, apoptosis mediators PARP-1, p53, and cleaved caspase-3 in HKC-8 cells, which were abolished by KP1. Longitudinal high-throughput live cell imaging also revealed that KP1 time-dependently suppressed CDDP-triggered caspase-3/7 cleavage and activation after 24 h of incubation in HKC-8 cells (Figure 2e and f). Furthermore, KP1 restored mitochondrial proteins OPA1, Sam50 and mitofilin in CDDP-treated HKC-8 cells (Figure 2g and h).  Stimulated emission depletion (STED) microscopy revealed an imaging of mitochondria with nanoscale resolution and showed elongated mitochondria with fine cristae in live tubular epithelial cells.  However, CDDP induced dramatic transformation of mitochondrial structure, with smaller round shape due to increased fission and disorganized cristae (Figure 2i).  Quantitative determination showed that CDDP treatment reduced the size of mitochondria and the ratio of its length to its width (Figure 2j), while KP1 could restore all of these (Figure 2i and j). Label free live cell microscopy imaging showed that induced by CDDP mitochondria became small and short after 18 h with or without KP1treatment (Figure 2k). Mitochondria became much smaller and shorter without KP1 after 36 h, while recovered elongated with KP1 treatment (Figure 2k).

We also assessed the role of KP1 in protecting tubular cells against hypoxic injury by using a hypoxia/reoxygenation (H/R), an in vitro model imitating IRI in vivo. KP1 also reversed the ultrastructural changes of mitochondria triggered by H/R, as it alleviated mitochondria spherical transformation and cristae disorganization (Figure 2l). As shown in Figure 2n-q, KP1 inhibited H/R-induced upregulation of Kim-1, NGAL, PARP-1, p53, and cleaved caspase-3 in proximal tubular HKC-8 cells. Concomitantly, KP1 preserved mitochondrial integrity by restoring H/R-depleted OPA1, Sam50, mitofilin (Figure 2r and s). 

Figure 2. KP1 prevents renal tubular injury and mitochondrial disfunction in vitro. (a, b) Representative Western blot (a) and quantitative data (b) showed that KP1 abolished the induction of KIM-1 and NGAL proteins in CDDP-stimulated HKC-8 cells with KP1 treatment. (c, d) Representative Western blot (c) and quantitative data (d) showed that KP1 abolished the induction of PARP-1, p53 and c-CASP3 proteins in CDDP-stimulated cells with KP1 treatment. (e) Representative high-throughput live cell images showed the positive staining for cleaved caspase-3/7 in CDDP-stimulated cells with KP1 treatment at 24 h. Scale bar, 0.5 mm. (f) Displays the intensity of CASP3/7-positive green fluorescence signals over time (μm²/well). (g, h) Representative Western blot (g) and quantitative data (h) showed that KP1 restored OPA1, Sam50 and mitofilin protein levels in CDDP-stimulated HKC-8 cells with KP1 treatment. (i) Representative stimulated emission depletion (STED) micrographs showed the positive staining for mitochondria in 


KP1 elicits its protection by entering into tubular cells via endocytosis

KP1 has been reported to interact with TGF-β receptor II (TβR2) and inhibit its downstream signaling in CKD.  However, we found that CDDP and IRI did not significantly alter p-Smad3/Smad3 or TβR2 levels, which were also unaffected by KP1.  Therefore, these results suggest that KP1-mediated renoprotection following AKI is independent of regulating TGF-β/Smad3 signaling.

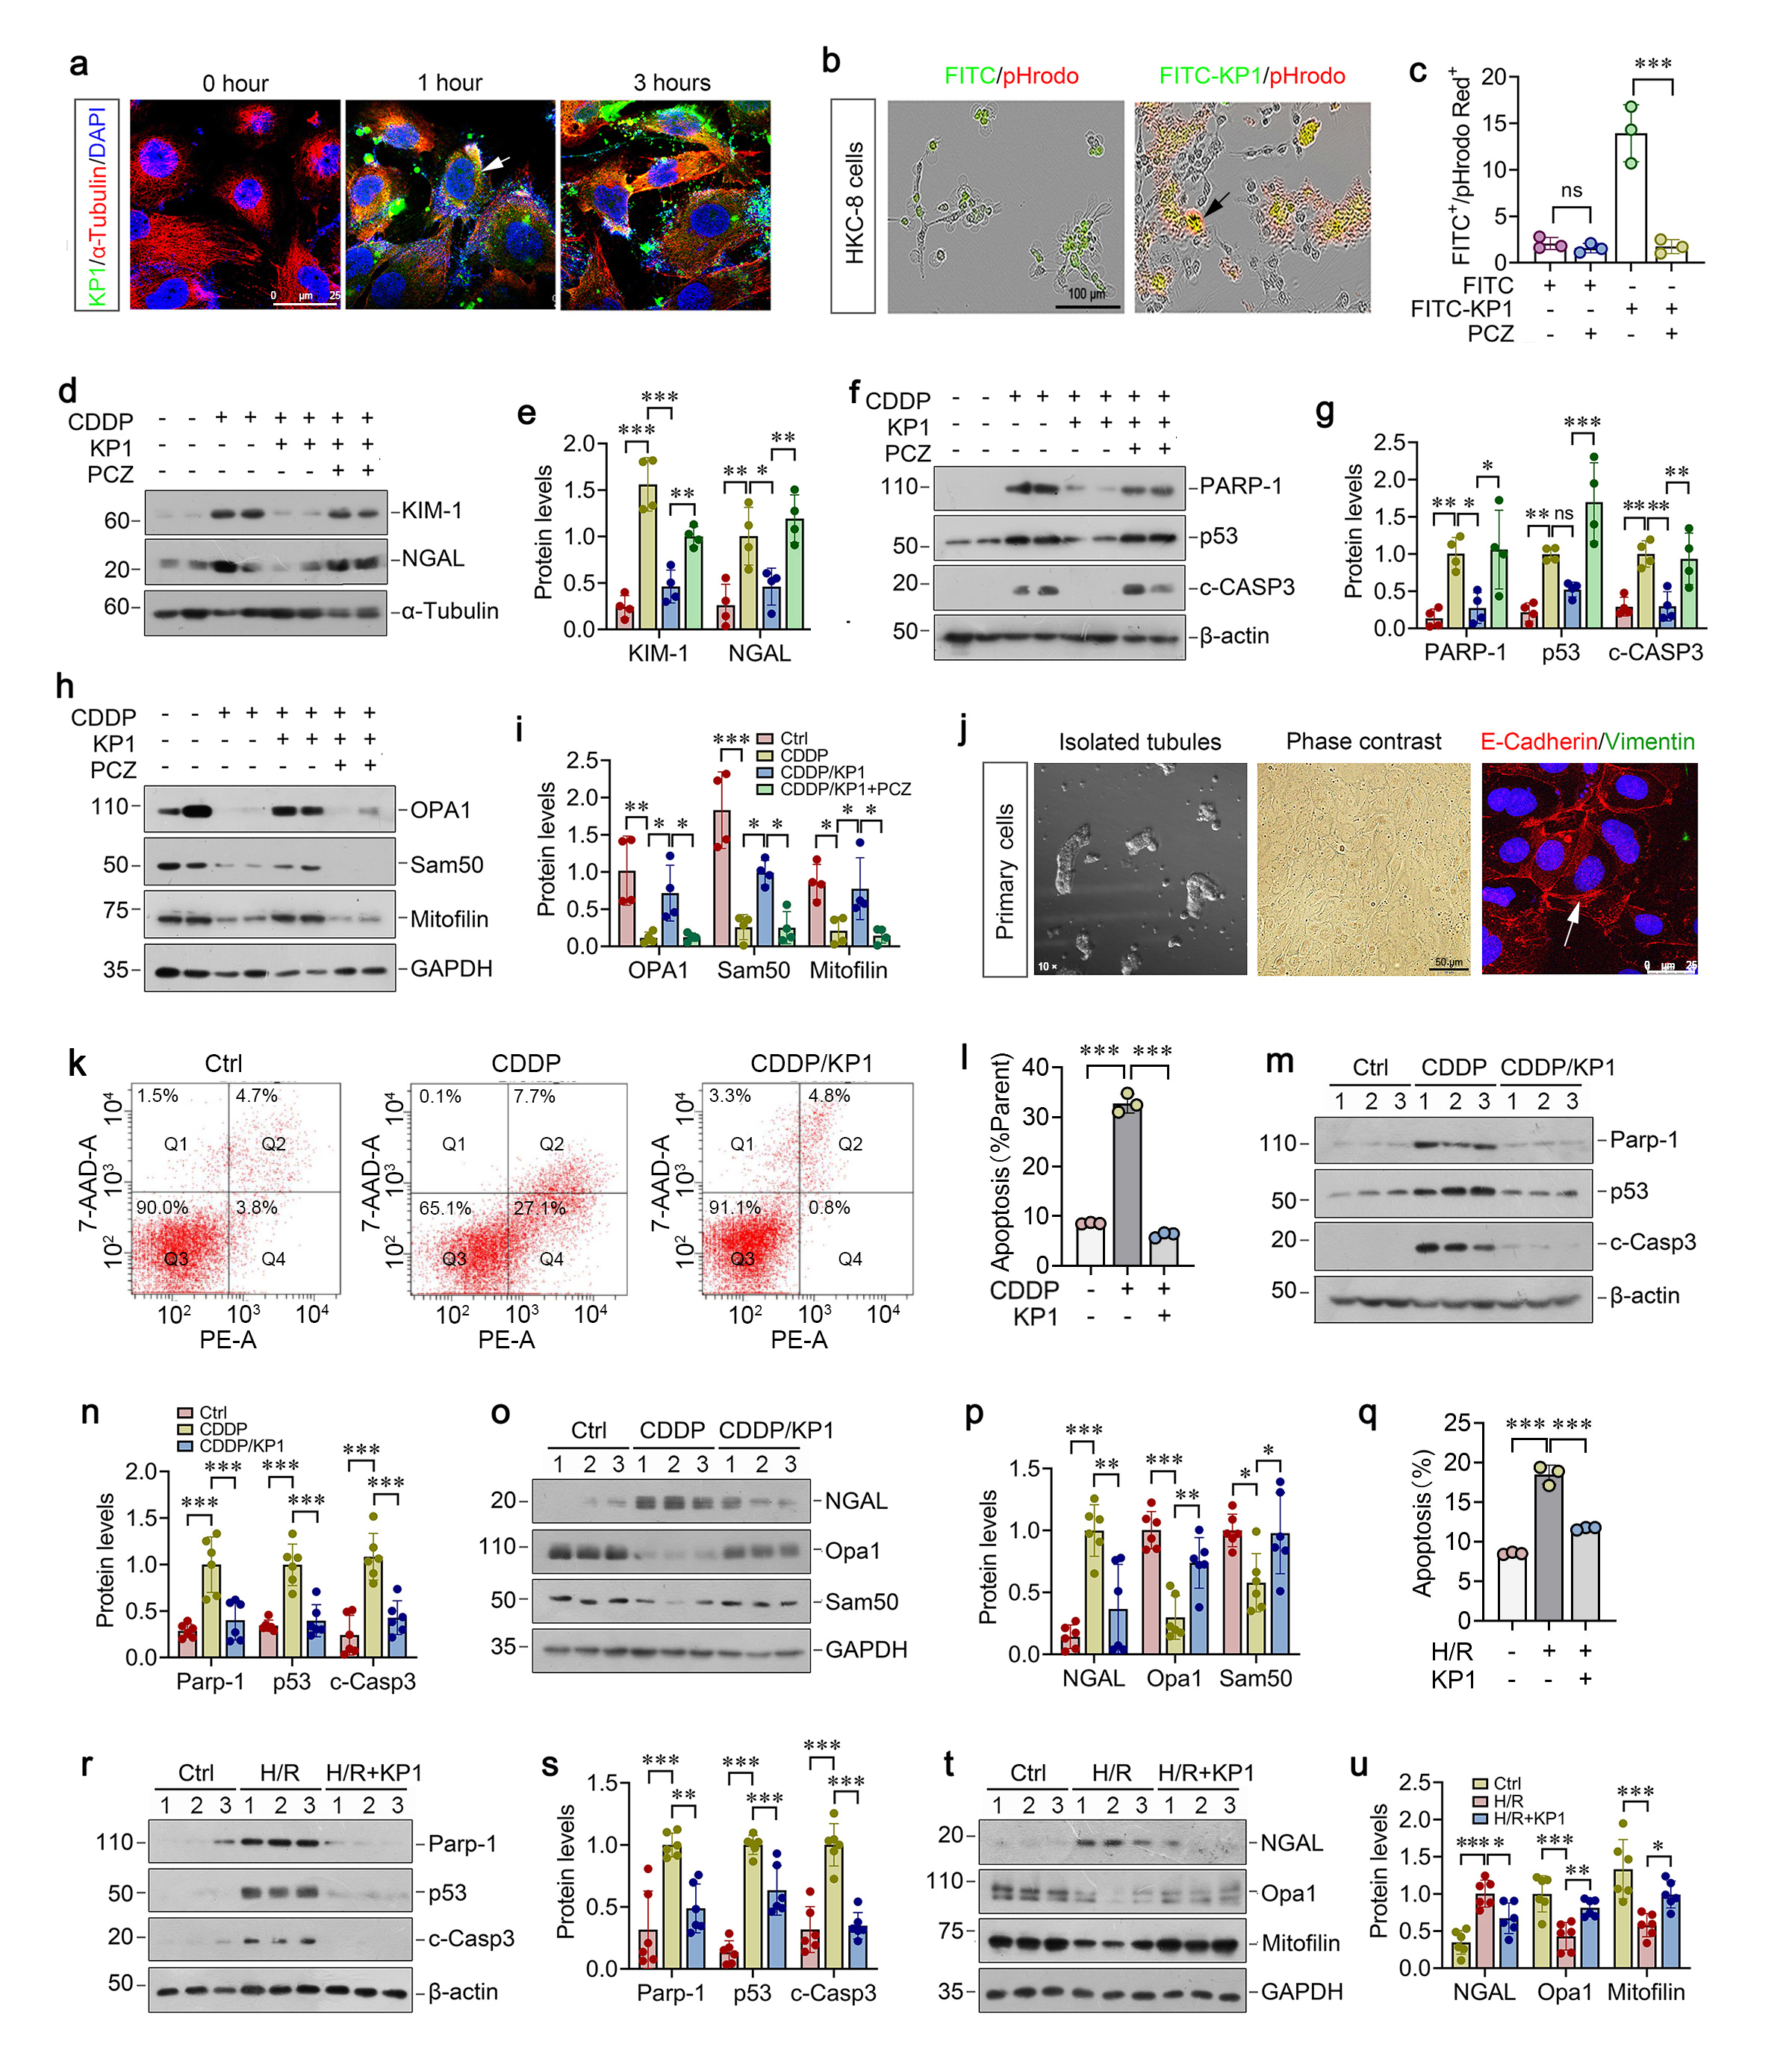
To elucidate the mechanisms by which KP1 protects against AKI, we first sought to investigate how KP1 elicits its activity by crossing plasma membrane.  To this end, we incubated HKC-8 cells with FITC-KP1 to trace its localization, and observed a time-dependent cytoplasmic accumulation of FITC-KP1 (Figure 3a).  Using longitudinal live-cell imaging and pHrodo-Red Dextran, we confirmed FITC-KP1 co-localization with endocytic vesicles at 3 h, whereas co-staining unconjugated FITC and pHrodo-Red was negligible (Figure 3b), indicating endocytosis-dependent uptake of KP1 by HKC-8 cells.  Furthermore, incubation with endocytosis inhibitor prozaleazine (PCZ) clearly blocked FITC-KP1 entry to HKC-8 cells, as assessed by flow cytometry (Figure 3c).  

We found that blockade of KP1 uptake by PCZ abolished the cytoprotective activity of KP1 following CDDP treatment.  In the presence of PCZ, KP1 was unable to inhibit Kim-1, NGAL, PARP-1, p53, cleaved caspase-3 induction by CDDP (Figure 3d-g).  Similarly, blockade of KP1 uptake by PCZ also abolished the ability of KP1 to restore mitochondrial proteins OPA1, Sam50, and mitofilin in HKC-8 cells (Figure 3h and i).  These results indicate that the reno-protective role of KP1 is dependent on its entry into tubular epithelial cells.  

To closely imitate the in vivo situation, we utilized primary mouse proximal tubular epithelial cells, characterized by E-cadherin⁺/vimentin⁻ immunostaining (Figure 3j), to assess the ability of KP1 to protect tubular cells against nephrotoxic or hypoxic injury.  As shown in Figure 3k and l, KP1 suppressed CDDP-induced apoptosis in primary tubular cells, as assessed by flow cytometry.  KP1 also repressed the expression of PARP-1, p53, and cleaved caspase-3 (Figure 3m and n). KP1 concurrently reduced injury marker NGAL and restored mitochondrial proteins OPA1 and Sam50 in primary tubular cells (Figure 3o-p).  Similarly,  KP1 was able to reduce cell apoptosis triggered by H/R (Figure 3q), inhibited H/R-induced PARP-1, p53, cleaved caspase-3 and NGAL expression, and restored mitochondrial OPA1 and mitofilin proteins after H/R treatment (Figure 3r-u).  

 Figure 3. KP1 elicits its protection by entering into tubular cells via endocytosis. (a) Representative micrographs of FITC-KP1-treated HKC-8 cells for 0, 1, 3 hours. (b) Representative micrographs showed the double-positive staining for FITC and pHrodo Red in FITC- or FITC-KP1-treated HKC-8 cells. Scale bar, 100 µm. (c) Flow cytometry plots analyzing FITC+/pHrodo Red+ double-positive cell populations after various treatments as indicated. (d-i) Western blotting analysis for (d, e) KIM-1 and NGAL, (f, g) PARP-1, p53 and c-CASP3, (h, i) OPA1, Sam50 and mitofilin protein levels in HKC-8 cells after various treatments as indicated. (j) Culture and characterization of mouse primary proximal tubular epithelial cells. Freshly isolated proximal tubules and primary tubular epithelial cells (phase contrast) are shown. Primary cells were characterized by immunostaining with specific antibodies against E-cadherin (green) and vimentin (red), respectively. (k) Representative flow cytometry scatter plots in CDDP-stimulated mouse primary proximal tubular epithelial cells with KP1 treatment for 7-AAD and PE staining. (l) Flow cytometry analyzing plots for apoptotic rate. (m-p) Western blotting analysis for (m, n) Parp-1, p53 and c-Casp3, (o, p) NGAL, Opa1 and Sam50 protein levels in CDDP-stimulated mouse primary proximal tubular epithelial cells with KP1 treatment. (q) Flow cytometry plots analyzing apoptotic rate in H/R-stimulated mouse primary proximal tubular epithelial cells with KP1 treatment. (r-u) Western blotting analysis for (r, s) Parp-1, p53 and c-Casp3, (t, u) NGAL, Opa1 and mitofilin protein levels in H/R-stimulated mouse primary proximal tubular epithelial cells with KP1 treatment.


KP1 directly binds mitochondrial protein ATAD3A

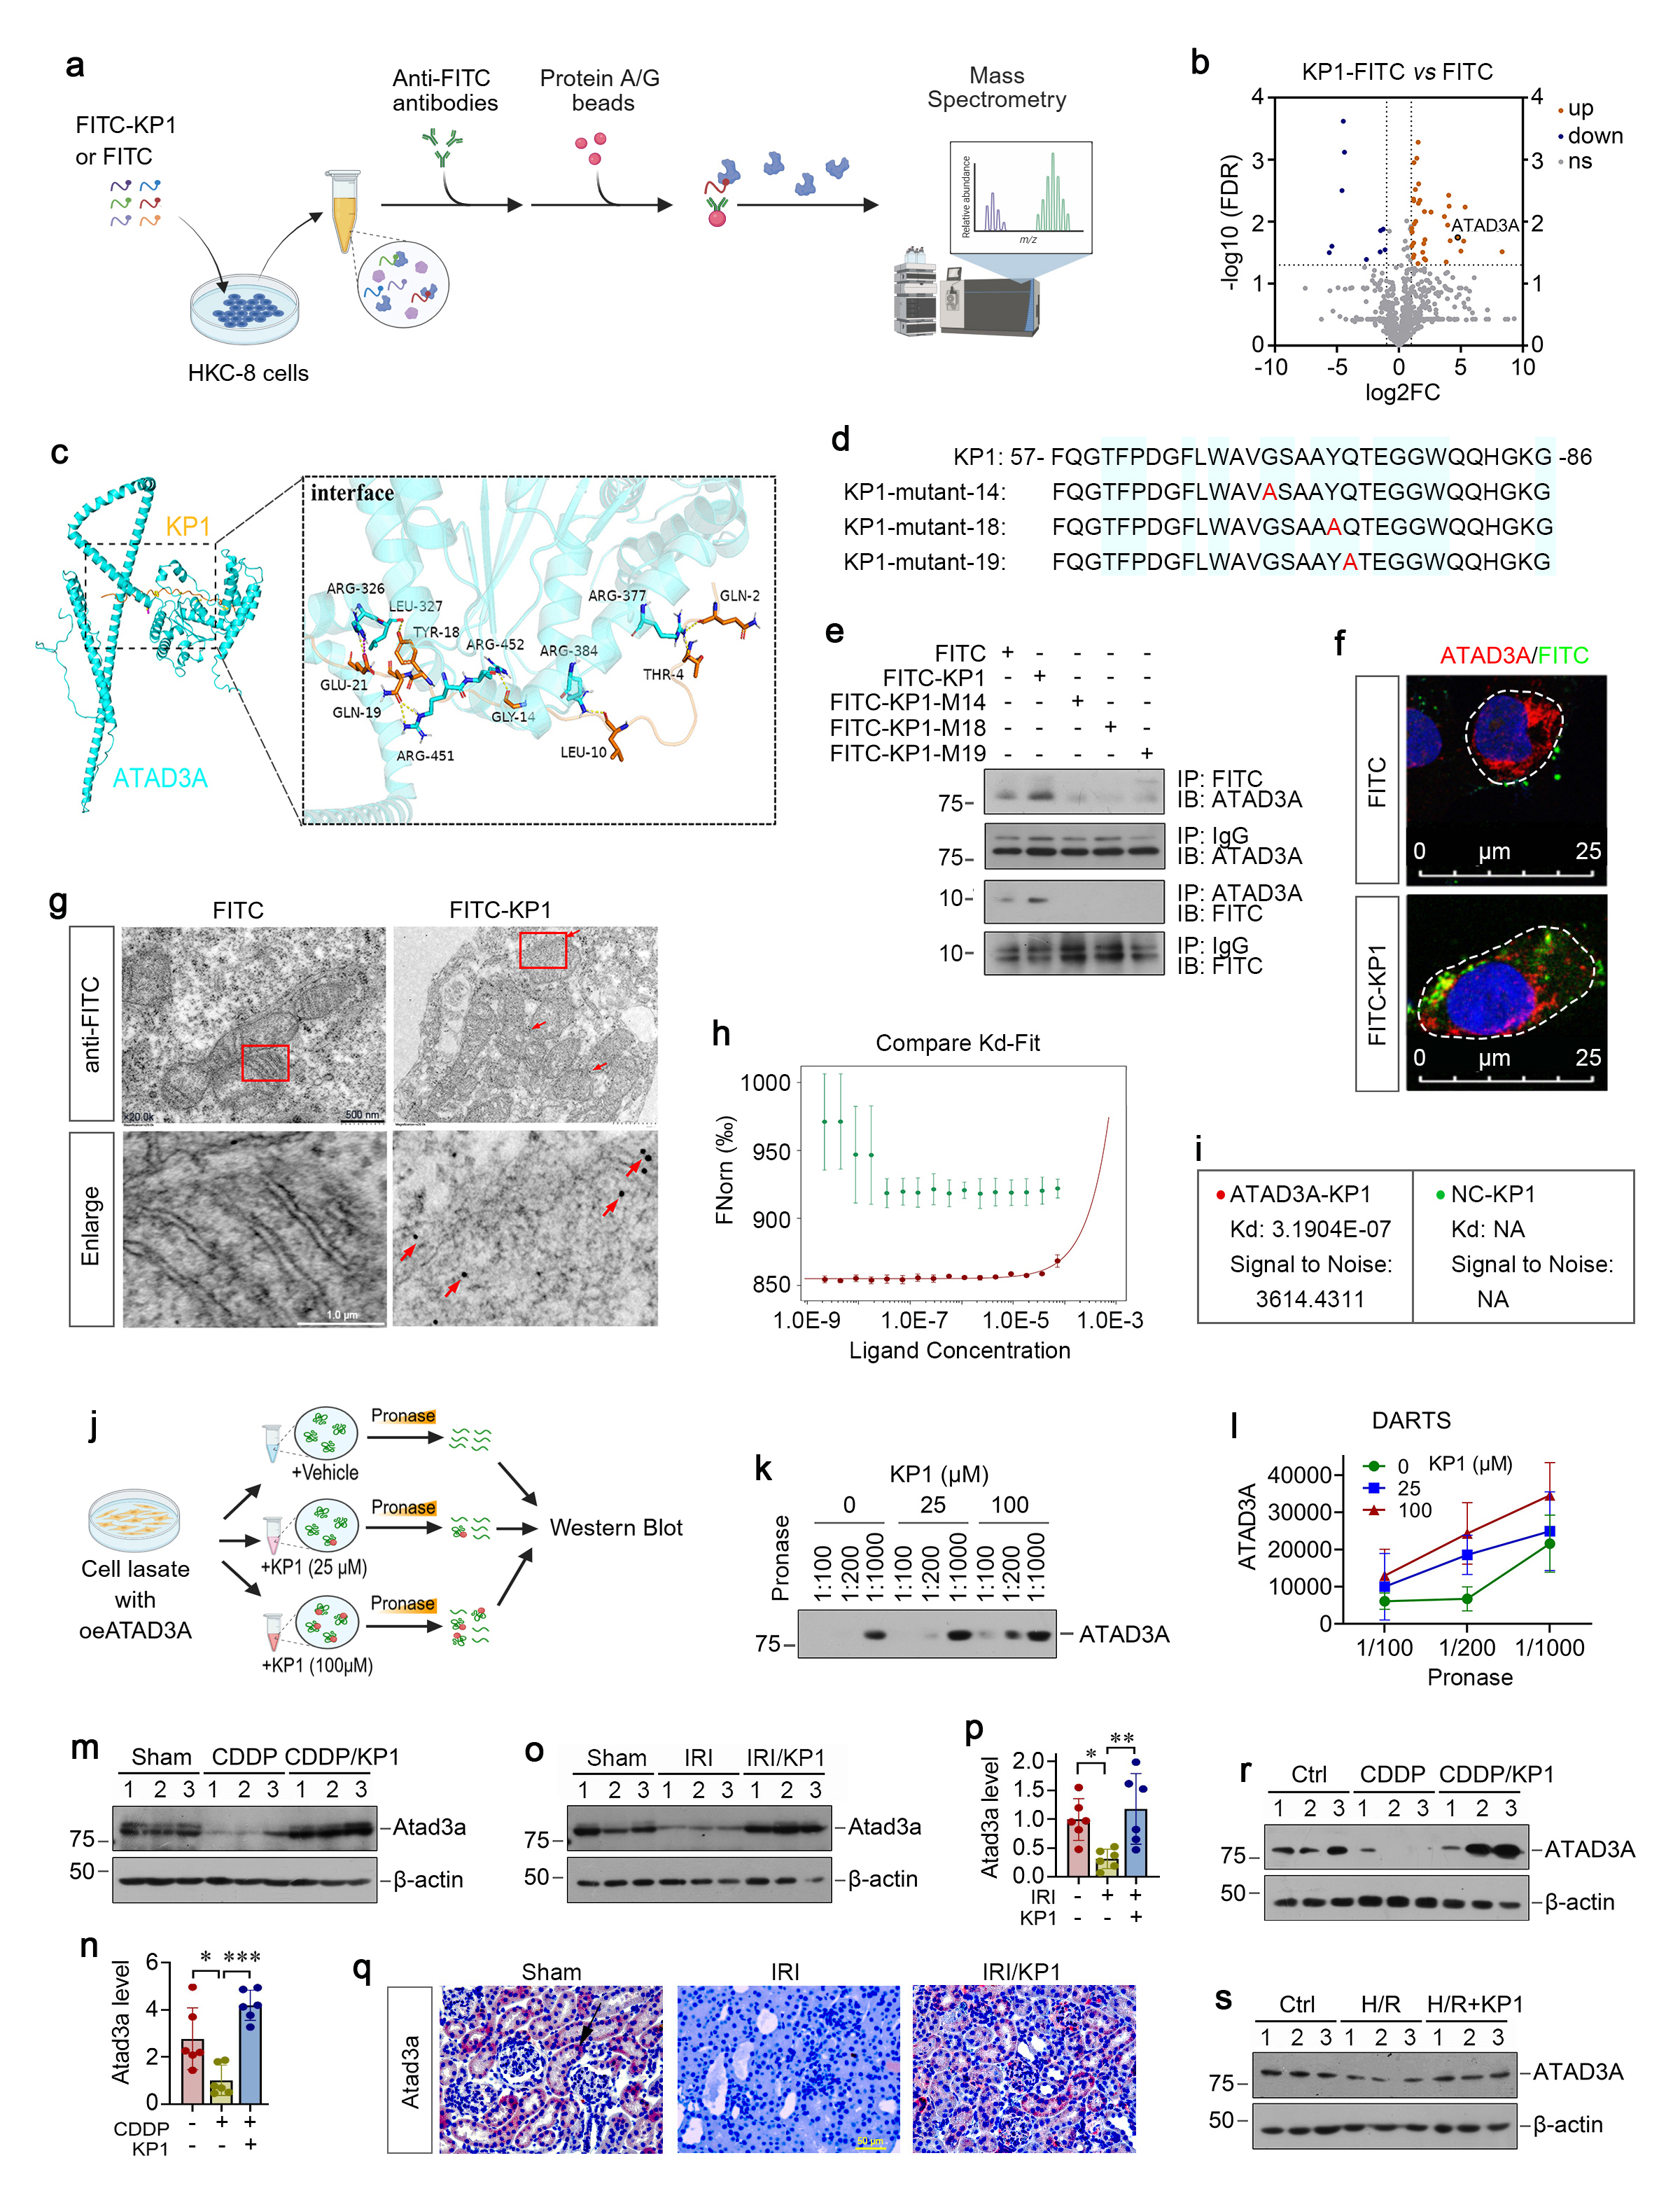
To identify intracellular targets of KP1, we employed co-immunoprecipitation coupled with mass spectrometry (Co-IP/MS) approach.  HKC-8 cells were incubated with FITC or FITC-KP1, and underwent immunoprecipitation using anti-FITC-conjugated agarose beads, followed by analyzing with mass spectrometry (Figure 4a).  Co-IP/MS revealed that KP1 interacted with multiple mitochondrial proteins.  Among them, the most prominent one was ATAD3A (Figure 4b).  Molecular docking simulation revealed that KP1 exhibited high affinity to ATAD3A, with G14, Y18 and Q19 as contact sites, which corresponded to Gly70, Tyr74 and Gln75 in human αKlotho protein, respectively (Figure 4c and d).  Furthermore, Co-IP analysis demonstrated that FITC-KP1 physically interacted with ATAD3A in HKC-8 cells (Figure 2C and D), validating the binding of KP1 to ATAD3A.  Point mutations of KP1 by substituting with alanine at the predicted binding residues G14, Y18, and Q19 abolished KP1/ATAD3A interaction in Co-IP assays (Figure 4e).  Confocal microscopic imaging confirmed the intracellular co-localization of KP1 and ATAD3A (Figure 4f).  To further ascertain mitochondrial localization of KP1, we employed immunogold electron microscopy localize FITC-KP1 and visualized its presence to mitochondrial membranes in HKC-8 cells (Figure 4g), Microscale thermophoresis (MST), an immobilization-free and fluorescence-based biophysical analysis of interactions between biomolecules, confirmed high-affinity binding between KP1 and ATAD3A, with Kd = 3.19×10⁻⁷ M (Figure 4h and i).  

To investigate the sequel of KP1 binding to ATAD3A, we utilized the drug affinity responsive target stability (DARTS) assays (Figure 4j).  As shown in Figure 4k-l, KP1 dose-dependently protected ATAD3A from pronase-mediated degradation, indicating that KP1 stabilizes its target protein ATAD3A upon binding.  We found that in CDDP or IRI models, KP1 treatment completely prevented injury-induced ATAD3A depletion (Figure 4m-q).  Furthermore, tubular cell injury induced by CDDP or H/R caused depletion of ATAD3A protein in cultured HKC-8 cells, which was restored by KP1 incubation (Fig. 4r and s).  Collectively, these results indicate that KP1 can directly binds to mitochondrial protein ATAD3A and stabilizes it by preventing injury-induced degradation.  

Figure 4. KP1 directly binds mitochondrial protein ATAD3A. (a) Experimental workflow diagram for identifying KP1-targeted proteins using co-immunoprecipitation-mass spectrometry (Co-IP/MS). (b) Volcano plots of the differentially pull-down proteins in HKC-8 cells of FITC versus FITC-KP1 (n=3 biologically independence). (c) Molecular docking simulation of KP1 with ATAD3A, with KP1 in orange and ATAD3A in blue. (d) KP1 and its mutant sequences, with blue background representing conserved sequences. (e) Co-IP demonstrated that KP1 bound to ATAD3A. ATAD3A-overexpression HKC-8 cell lysates (500 µg) and FITC, FITC-KP1, FITC-KP1-M14, FITC-KP1-M18, FITC-KP1-M19 (10 µg) were immunoprecipitated (IP) with the anti-FITC antibody at 4 ℃ overnight, followed by immunoblotted (IB) for ATAD3A;in the reciprocal experiment, mixtures were IP with anti-ATAD3A, followed by IB for FITC. (f) Representative immunofluorescence micrographs of ATAD3A in HKC-8 cells with FITC or FITC-KP1 treatment. Scale bar, 25 µm. (g) Representative immunoelectron micrographs demonstrating mitochondrial membrane localization of KP1. HKC-8 cells were treated with FITC or FITC-KP1, and arrowheads indicate FITC-positive signals. (h, i) MST binding curves of KP1-ATAD3A interaction. X-axis represents ligand (KP1) concentration (μM), while Y-axis represents normalized fluorescence intensity. Red curve: KP1 titration with lysate from 293T cells overexpressing ATAD3A-GFP fusion protein. Green curve: KP1 titration with lysate from 293T cells overexpressing GFP protein. (Calculated Kd = 3.19 × 10⁻⁷). (j) Experimental workflow diagram for drug affinity responsive target stability (DARTS) analysis of ATAD3A-KP1 interaction. Lysates from ATAD3A-overexpressing cells were incubated with KP1 (0, 25, or 100 μM) followed by digestion with Pronase at 1:100, 1:200, and 1:1000 dilutions. (k) ATAD3A protein levels were assessed by immunoblotting. (l) Quantification of band intensity: ATAD3A degradation rates decreased dose-dependently with KP1. (m, n) Western blotting analysis for Atad3a protein level in CDDP mice with KP1 treatment. (o, p) Western blotting analysis for Atad3a protein level in IRI mice with KP1 treatment. (q) Representative immunostaining for Atad3a in IRI mice with KP1 treatment. (r) Representative Western blot showed that KP1 restored ATAD3A protein level in CDDP-stimulated HKC-8 cells with KP1 treatment. (s) Representative Western blot showed that KP1 restored ATAD3A protein level in H/R-stimulated HKC-8 cells with KP1 treatment.


ATAD3A preserves mitochondrial functions and protects against AKI in vivo 

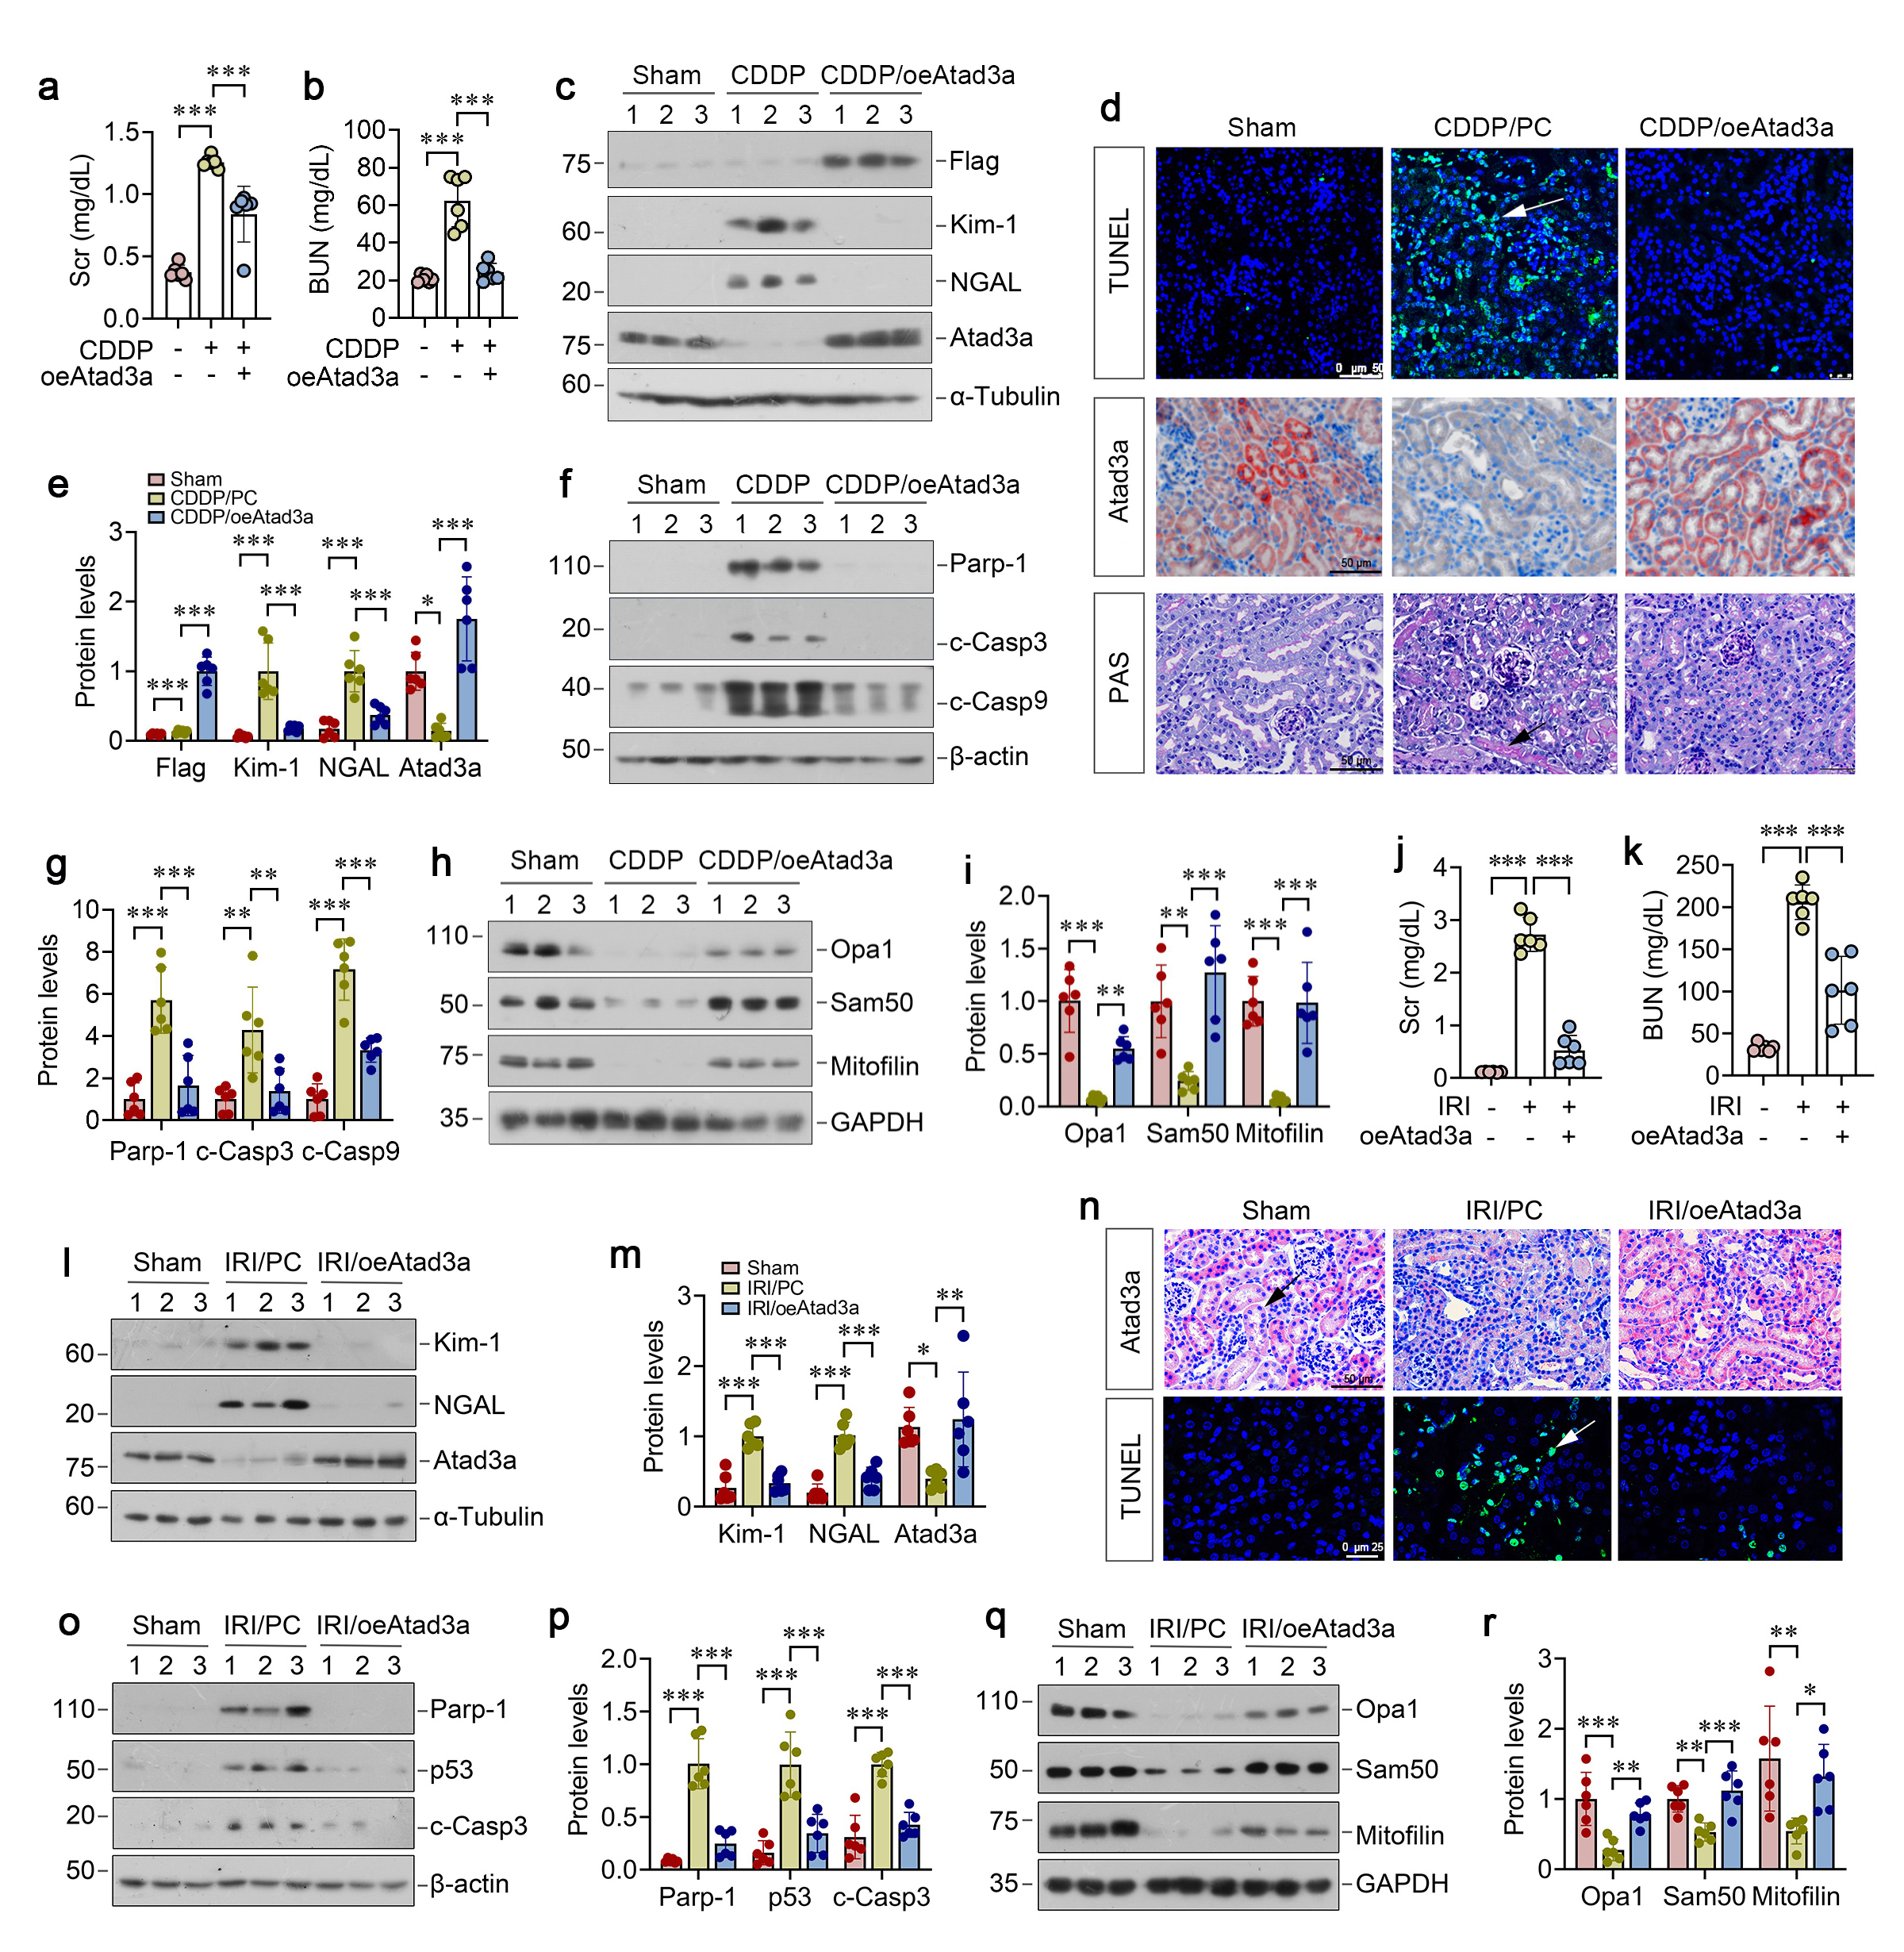
To explore the role of ATAD3A in regulating AKI, we injected mice with expression plasmid encoding Flag-tagged ATAD3A (pFlag-ATAD3A) 2 days before injection with CDDP.  As shown in Figure 5a and b, overexpression of exogenous ATAD3A reduced Scr and BUN levels and mitigated kidney dysfunction.  Notably, the expression of exogenous ATAD3A was confirmed by immunoblotting for Flag and ATAD3A in the kidneys (Figure 5c and e).  Immunohistochemical staining also demonstrated that ATAD3A expression was completely restored in renal tubular epithelium in mice injected with pFlag-ATAD3A plasmid (Figure 5d).  Overexpression of exogenous ATAD3A also suppressed the expression of tubular injury markers Kim-1, NGAL (Fig. 5c, e) and apoptosis markers PARP-1, cleaved caspase-3/9 (Fig. 5f and g).  TUNEL staining and histopathological assessment revealed a reduced TUNEL⁺ cells, accompanied by mitigated tubular dilation and cast deposition after ATAD3A overexpression (Fig. 5d).  ATAD3A also preserved mitochondrial proteins OPA1, Sam50 and mitofilin in the kidney after CDDP treatment (Fig. 5g-h).  

We also investigated the effect of exogenous ADAT3A on IRI.  As shown in Figure 5j-p, overexpression of ATAD3A decreased Scr and BUN levels, inhibited the expression of Kim-1, NGAL, PARP-1, p53 and cleaved caspase-3, and reduced TUNEL+ apoptotic cells in the kidneys of mice subjected to IRI.  ATAD3A overexpression also largely preserved mitochondrial proteins OPA1, Sam50 and mitofilin, underscoring its role in protecting mitochondrial integrity (Figure 5 q and r). 

Figure 5. ATAD3A preserves mitochondrial functions and protects against AKI in vivo. (a, b) Graphic presentation shows the Scr and BUN levels in CDDP mice with Atad3a overexpression. (c) Representative Western blot analyses of Flag, Kim-1, NGAL and Atad3a proteins in CDDP mice after injection with Atad3a-overexpression plasmids. (d) Representative immunostaining for Atad3a and PAS and TUNEL staining in CDDP mice with Atad3a overexpression. (e) Quantitative data of Flag, Kim-1, NGAL and Atad3a protein levels. (f-i) Western blotting analysis for (f, g) Parp-1, c-Casp3 and c-Casp9, (h, i) Opa1, Sam50 and mitofilin protein levels in CDDP mice with Atad3a overexpression. (j, k) Graphic presentation shows the Scr and BUN levels in IRI mice with Atad3a overexprsiion. (l, m) Western blotting analysis for Kim-1, NGAL and Atad3a. (n) Representative immunostaining for Atad3a and TUNEL staining in IRI mice with Atad3a overexpression. (o-r) Western blotting analysis for (o, p) Parp-1, p53 and c-Casp3, (q, r) Opa1, Sam50 and mitofilin protein levels in IRI mice with Atad3a knockdown.


ATAD3A alleviates tubular cell mitochondrial dysfunction after injury in vitro

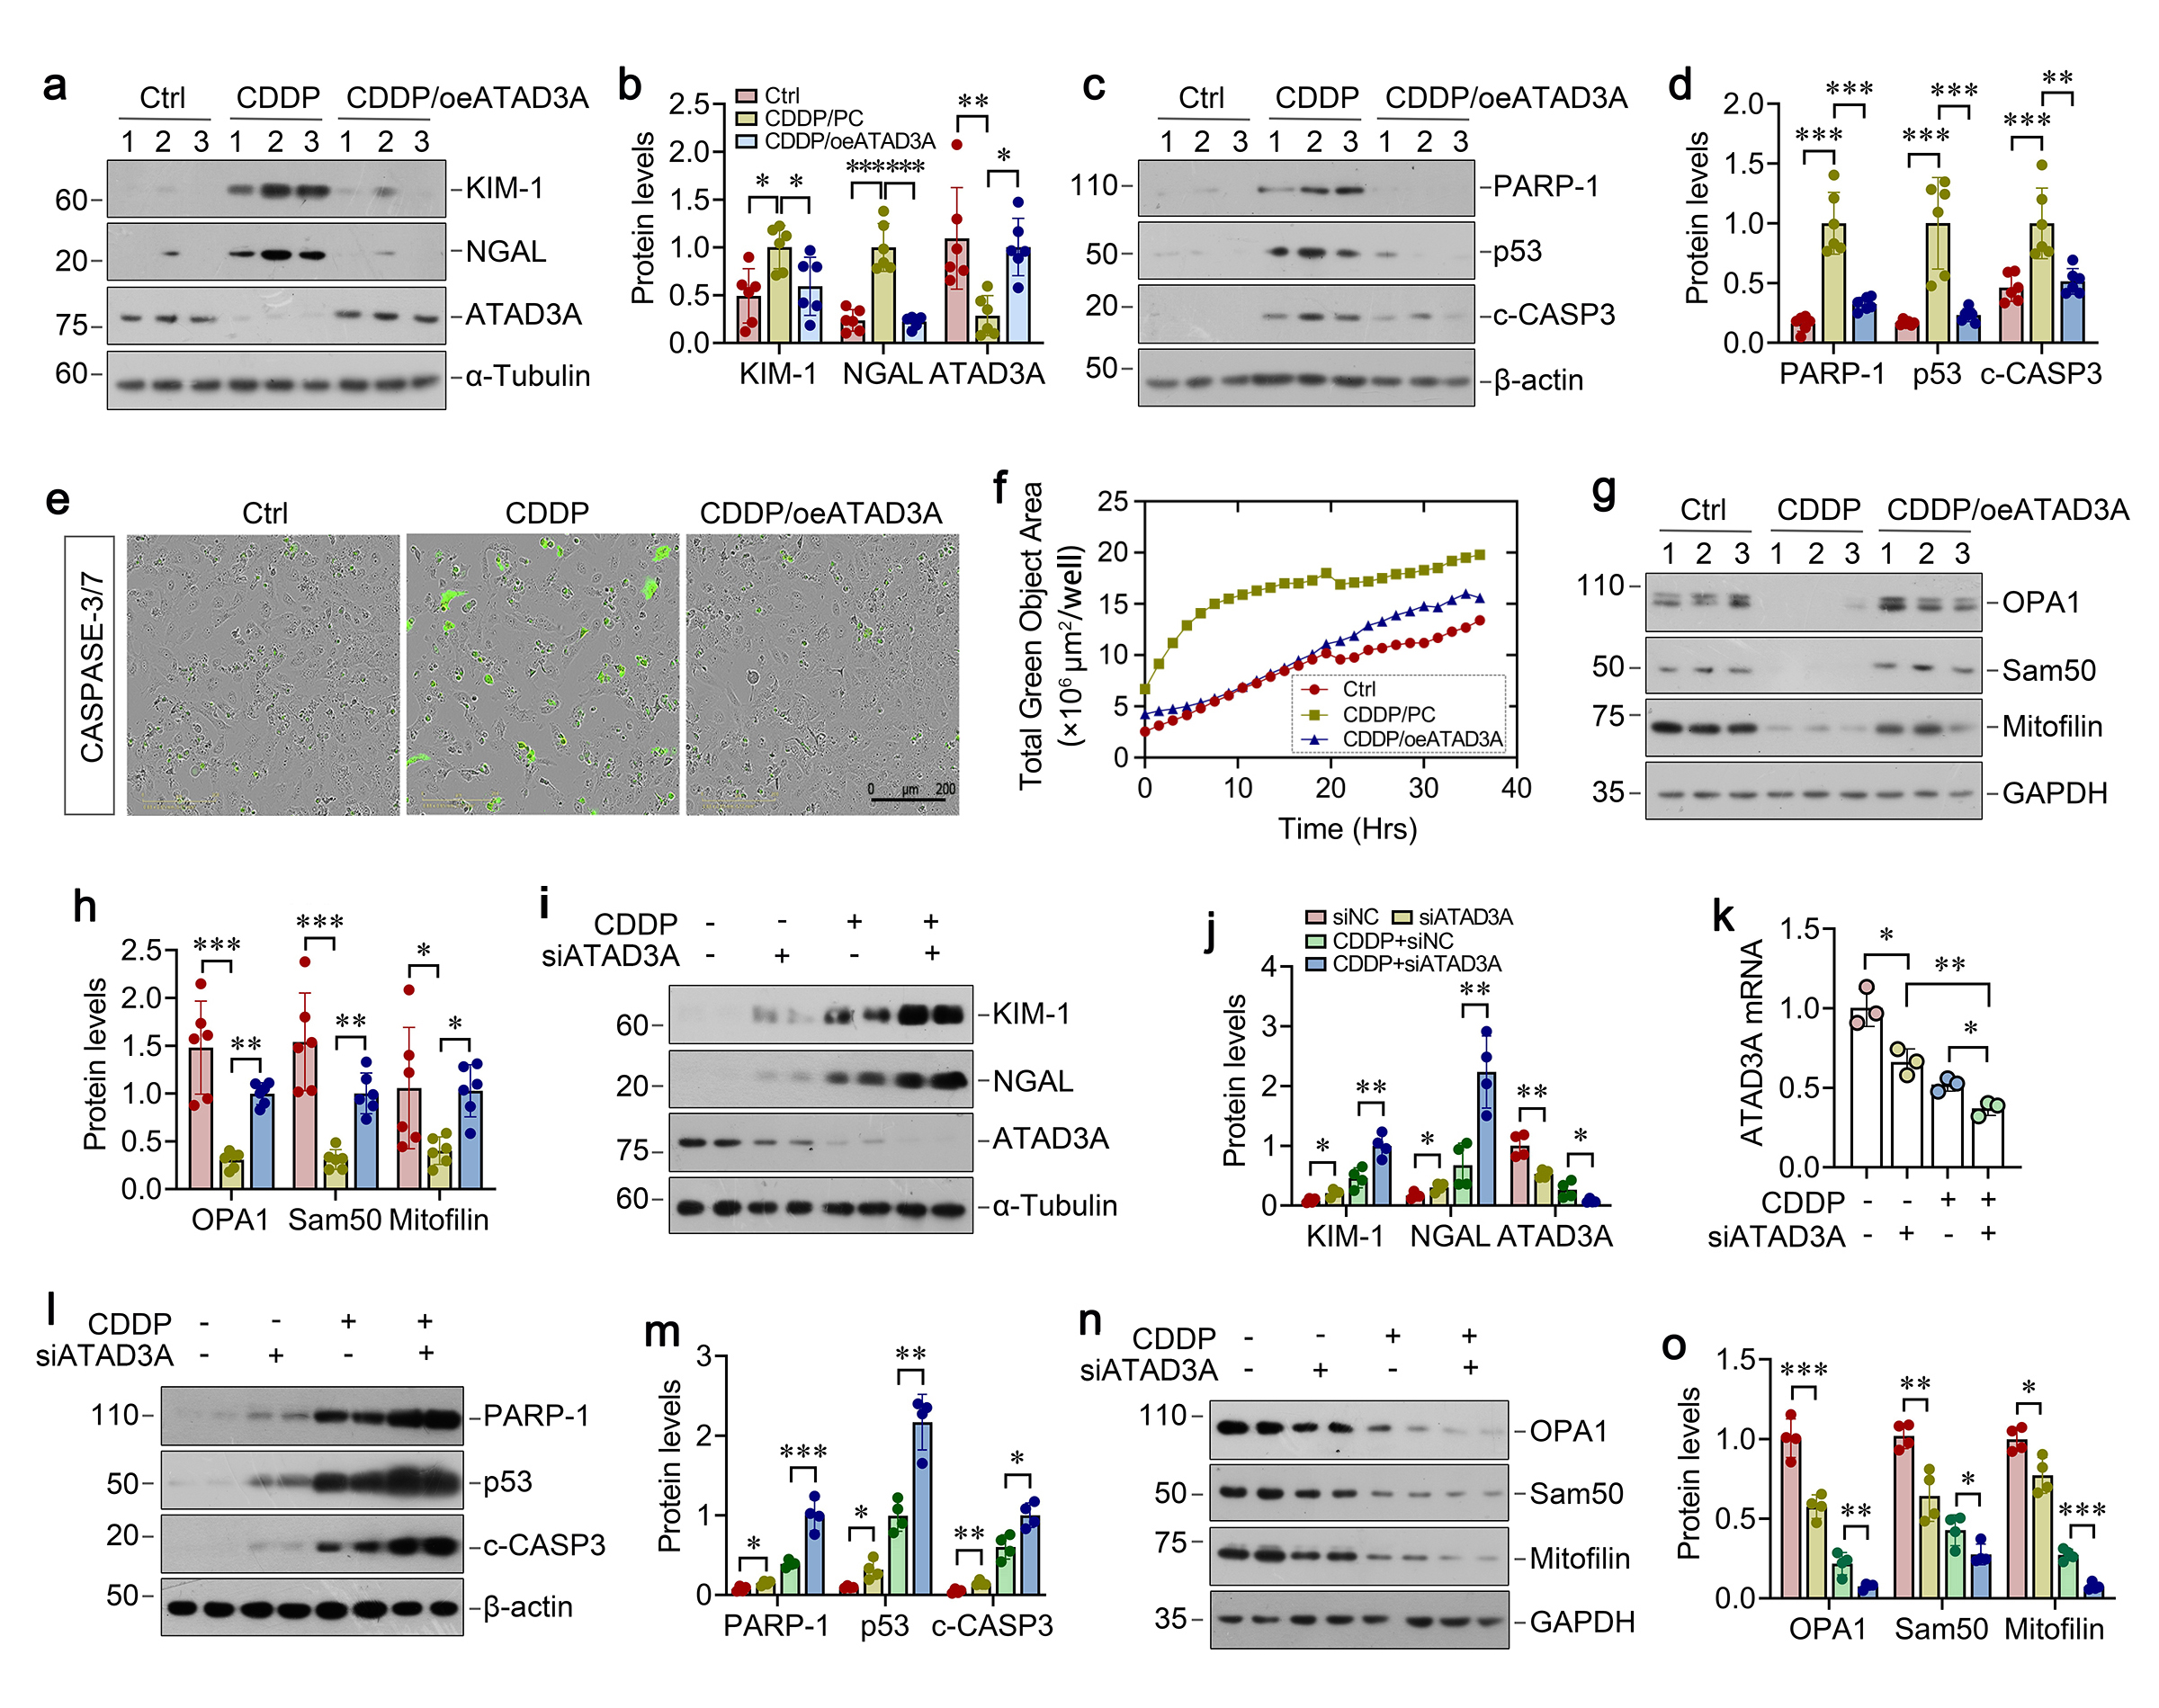
We further investigated the role of ATAD3A in protecting against mitochondrial dysfunction after injury by using cultured HKC-8 cells.  As shown in Figure 6a and b, overexpressing ATAD3A restored its protein levels and suppressed Kim-1 and NGAL after CDDP treatment.  Overexpression of ATAD3A also prevented CDDP-induced PARP-1, p53 and cleaved caspase-3 expression (Figure 6c and e).  Live-time imaging confirmed that ATAD3A overexpression inhibited CDDP-triggered activation of caspase-3 and -7 (Figure 6e and f).  The protective effect of ATAD3A was associated with the restoration of mitochondrial proteins OPA1, Sam50 and mitofilin in HKC-8 cells (Figure 6g and h), suggesting that ATAD3A alone sufficiently protects against CDDP-induced mitochondrial dysfunction and apoptosis.  

We then confirmed the role of ATAD3A in preserving mitochondrial integrity by knocking down its expression using small interfering RNA (siRNA) approach.  As shown in Figure 6i-m, knockdown of ATAD3A by siATAD3A in HKC-8 cells slightly induced Kim-1, NGAL, PARP-1, p53, and cleaved caspase-3 expression, suggesting that ATAD3A depletion spontaneously induced tubular injury and apoptosis.  Moreover, knockdown of ATAD3A further exacerbated CDDP-triggered induction of these proteins (Fig. 6i-m).  ATAD3A loss also aggravated mitochondrial dysfunction, as evidenced by decreased OPA1, Sam50, and mitofilin proteins (Figure 6n and o).

Figure 6. ATAD3A alleviates CDDP-induced mitochondrial dysfunction in vitro. (a-d) Western blotting analysis for (a, b) KIM-1, NGAL and ATAD3A, (c, d) PARP-1, p53 and c-CASP3 protein levels in CDDP-stimulated cells with ATAD3A overexpression. (e) Representative CASP3/7 staining images in ATAD3A-overexpression CDDP-stimulated cells. Scale bar, 200 μm. (f) Displays the intensity of CASP3/7-positive green fluorescence signals over time (μm²/well). (g, h) Western blotting analysis for OPA1, Sam50, mitofilin protein levels in CDDP-stimulated cells with ATAD3A overexpression. (i) Representative Western blot of KIM-1, NGAL and ATAD3A proteins in HKC-8 cells after treatment as indicated. (j) Quantitative data showed the levels of KIM-1, NGAL and ATAD3A proteinsand (k) ATAD3A mRNA in different groups as indicated. (l-o) Western blotting analysis for (l, m) PARP-1, p53 and c-CASP3, (n, o) OPA1, Sam50 and mitofilin protein levels in HKC-8 cells after treatment as indicated.


ATAD3A preserves mitochondrial integrity through direct interaction with HIGD2A

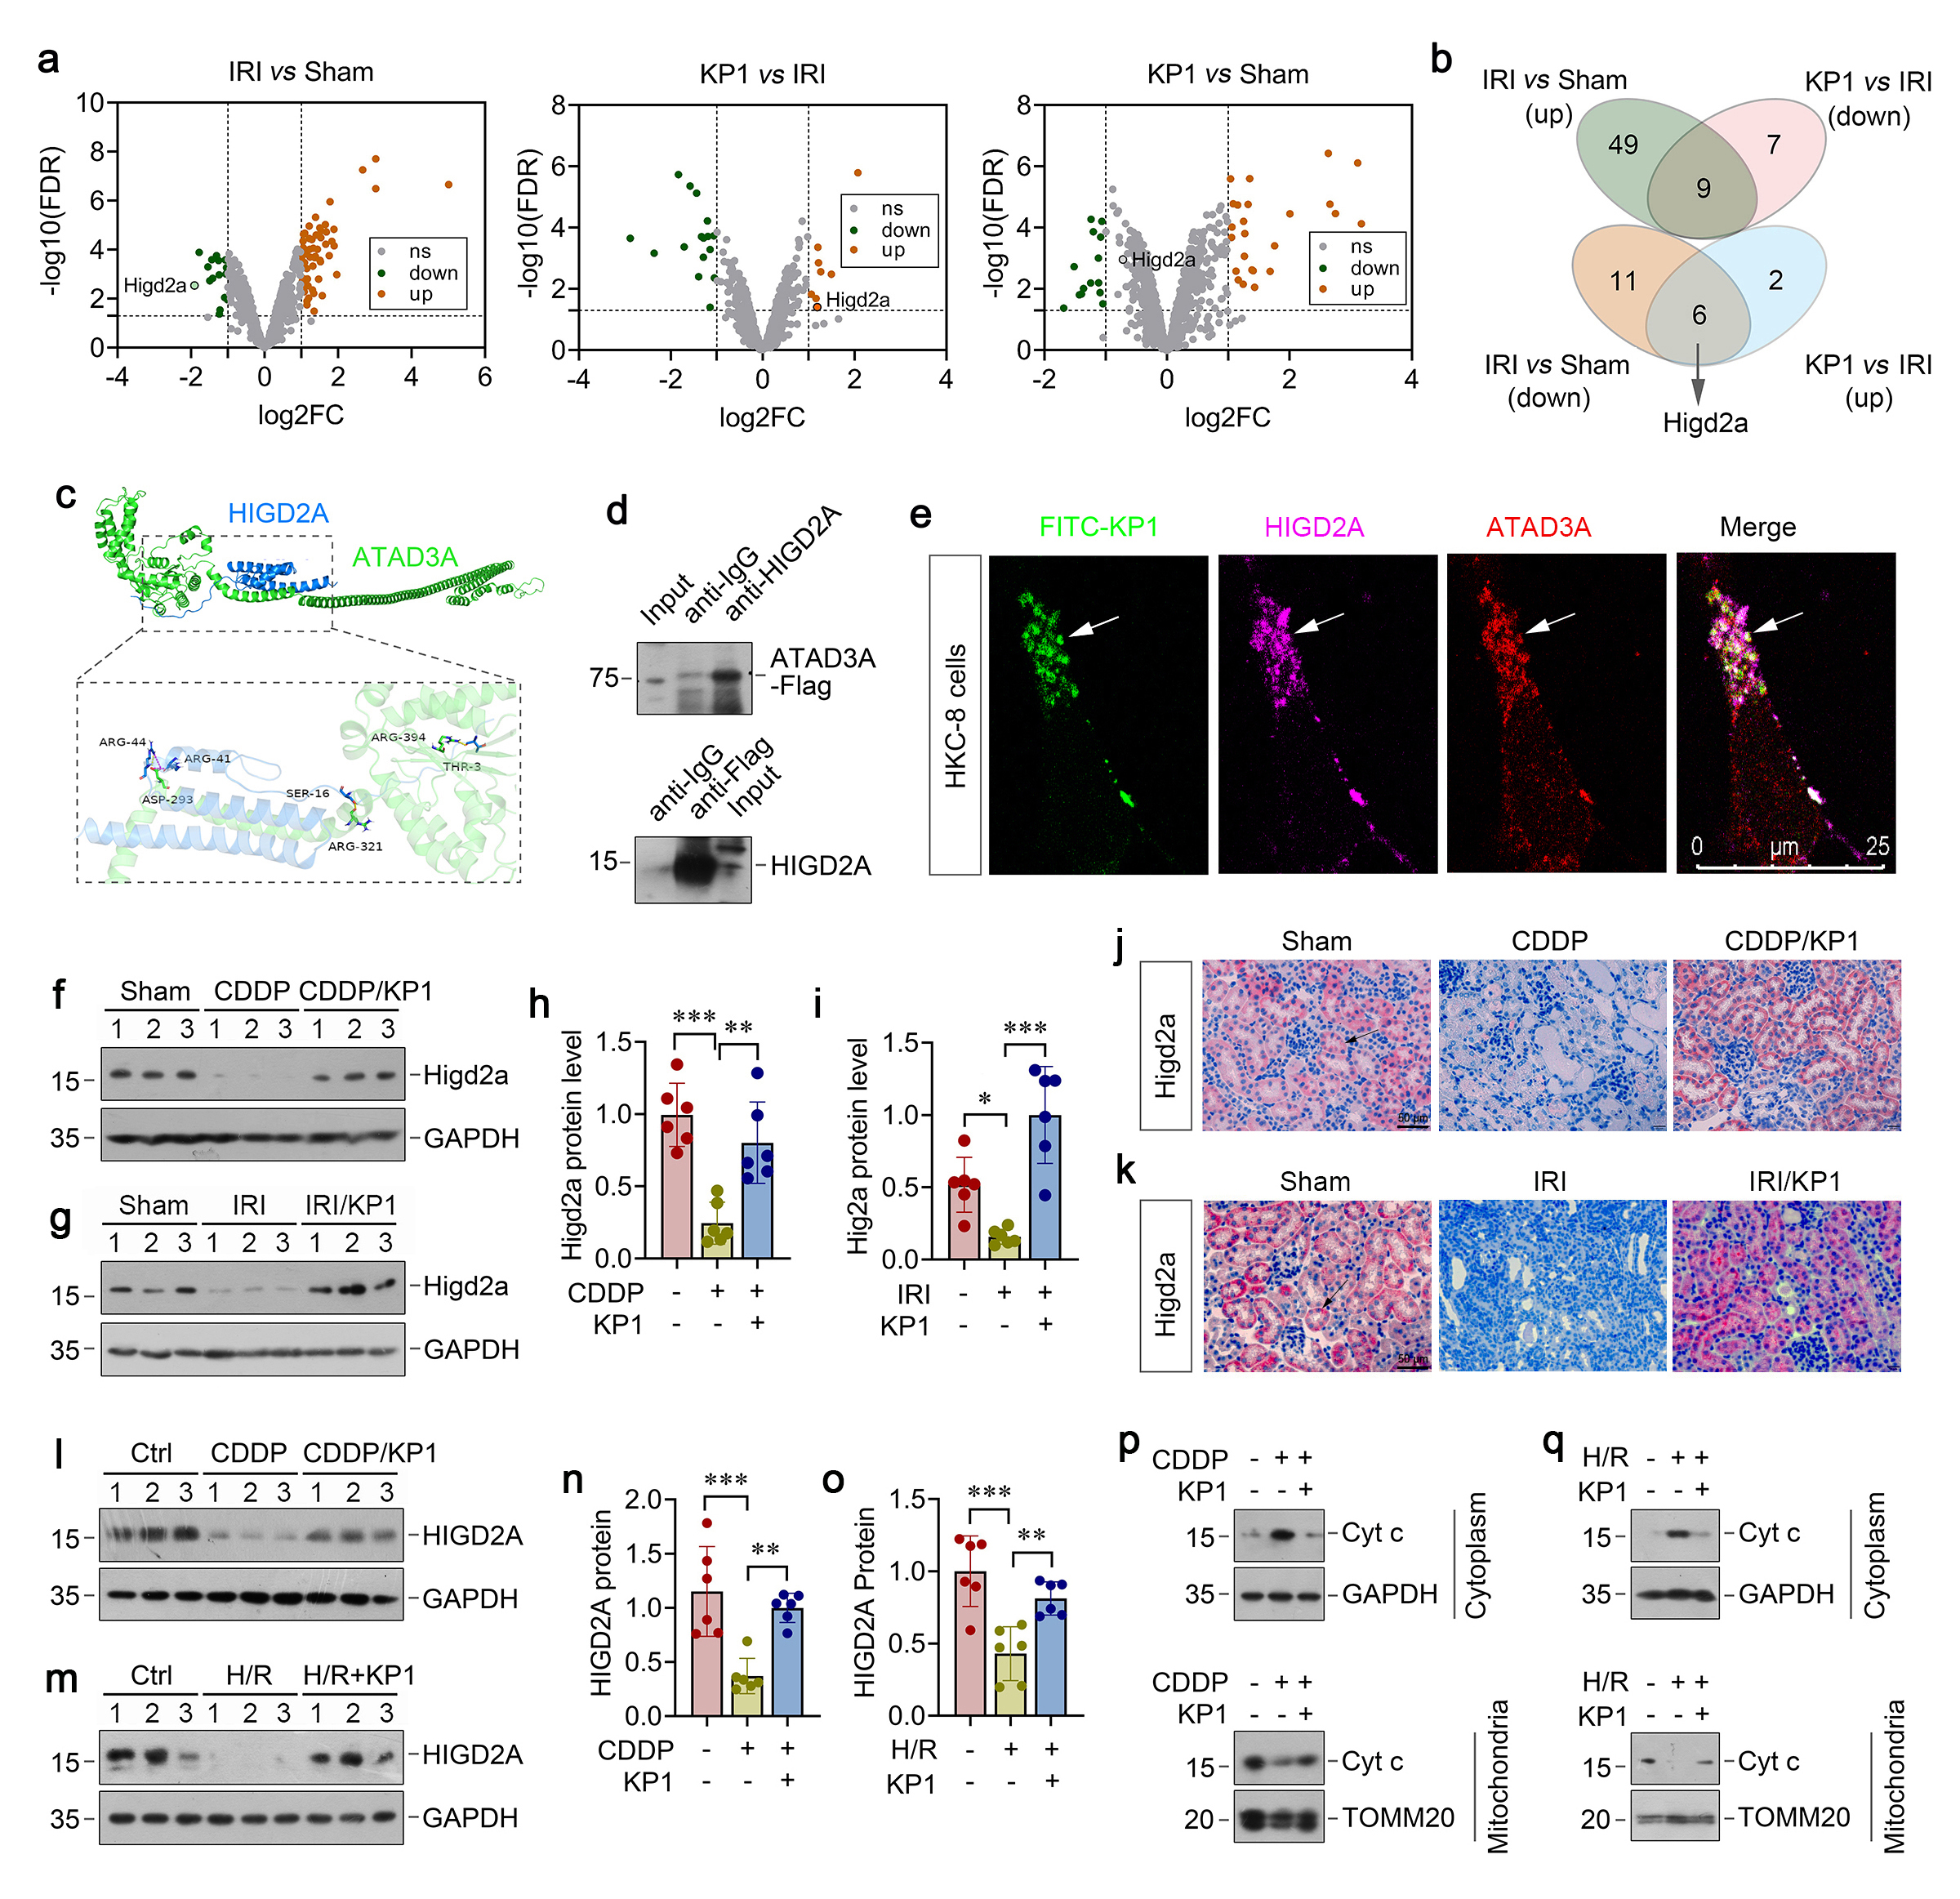
To elucidate the mechanism underlying ATAD3A protection against mitochondrial dysfunction, we sought to identify the direct targets of ATAD3A in mitochondria by using unbiased proteomic approach.  To this end, mitochondria were isolated from kidneys and subjected to mass spectrometry (MS).  We identified 58 upregulated and 17 downregulated proteins in IRI group versus sham controls (Figure 7a).  Comparing to IRI, KP1 treatment resulted in 8 upregulated and 16 downregulated proteins (Figure 7a).  Among them, KP1 restored the expression of 6 mitochondrial proteins that were downregulated in IRI kidneys.  On the top of the list was the hypoxia inducible gene 1 (HIG1) domain family member 2A (HIGD2A), a subunit of the cytochrome c oxidase complex (complex IV) (Figure 7b).  Molecular docking simulation predicted a strong ATAD3A-HIGD2A interaction, with a binding free energy of -115.99 kcal/mol (Figure 7c).  To validate the interaction between ATAD3A and HIGD2A, we carried out co-immunoprecipitation assay.  After incubation over-expressing Flag-tagged ATAD3A lysates with anti-HIGD2A antibody, ATAD3A was detected in the immunocomplexes (Figure 7d).  In the reciprocal experiments, HIGD2A was also readily detected in the complexes precipitated by anti-Flag antibody (Figure 7d).  Confocal microscopy confirmed the co-localization of FITC-KP1, ATAD3A, and HIGD2A in HKC-8 cells (Figure 7e).  

We found that AKI caused by either CDDP or IRI resulted in marked downregulation of HIGD2A proteins, which was restored by KP1 in both models (Figure 7f-i).  IHC also revealed that KP1 could restore HIGD2A expression in mice renal tubular with AKI induced by CDDP or IRI (Figure 7j and k).  Similar results were obtained when HKC-8 cells were treated with CDDP or H/R (Figure 7l-o).  We found that loss of HIGD2A after treatment with CDDP or H/R was associated with the release of cytochrome c from mitochondria to cytosol and KP1 reversed such cytochrome c translocation (Figure 7p and q), which could trigger tubular cell apoptosis.

Figure 7. ATAD3A preserves mitochondrial integrity through direct interaction with HIGD2A. (a) Volcano plots of the differentially expressed proteins in the renal mitochondria of different groups as indicated, including ‘IRI versus Sham’, ‘IRI+KP1 versus IRI’, and ‘IRI+KP1 versus Sham’ (n=3 biologically independent animals). (b) Venn diagram showed the differential expression of mitochondrial proteins in the kidneys of different groups. (c) Molecular docking simulation of ATAD3A with HIGD2A, with ATAD3A in green and HIGD2A in blue. (d) Co-IP demonstrated that HIGD2A bound to ATAD3A.  ATAD3A-Flag-overexpression HKC-8 cell lysates (500 µg) were IP with the anti-HIGD2A antibody, followed by IB for ATAD3A; in the reciprocal experiment, mixtures were IP with anti-Flag antibody, followed by IB for FITC. (e) Representative immunofluorescence images showing co-localization of ATAD3A (red) and HIGD2A (purple) in FITC-tagged (green)-KP1-treated HKC-8 cells. Scale bar, 25 µm. (f, g) Representative Western blot for Higd2a protein in (f) CDDP mice and (g) IRI mice with KP1 treatment. (h, i) Quantitative data of Higd2a protein level in (h) CDDP mice and (i) IRI mice with KP1 treatment. (j, k) Representative immunostaining for Higd2a in (j) CDDP mice and (k) IRI mice with KP1 treatment. (l, m) Representative Western blot for Higd2a protein in (l) CDDP-stimulated and (m) H/R-stimulated HKC-8 cells with KP1 treatment. (n, o) Quantitative data of Higd2a protein level in (n) CDDP-stimulated and (o) H/R-stimulated HKC-8 cells with KP1 treatment. (p) Representative Western blot of cytosolic and nuclear cytochrome c (Cyt c) protein in KP1-treated HKC-8 cells subjected to CDDP injury. (q) Representative Western blotof cytosolic and nuclear Cyt c protein in KP1-treated HKC-8 cells subjected to H/R injury.


HIGD2A protects against renal tubular cell apoptosis

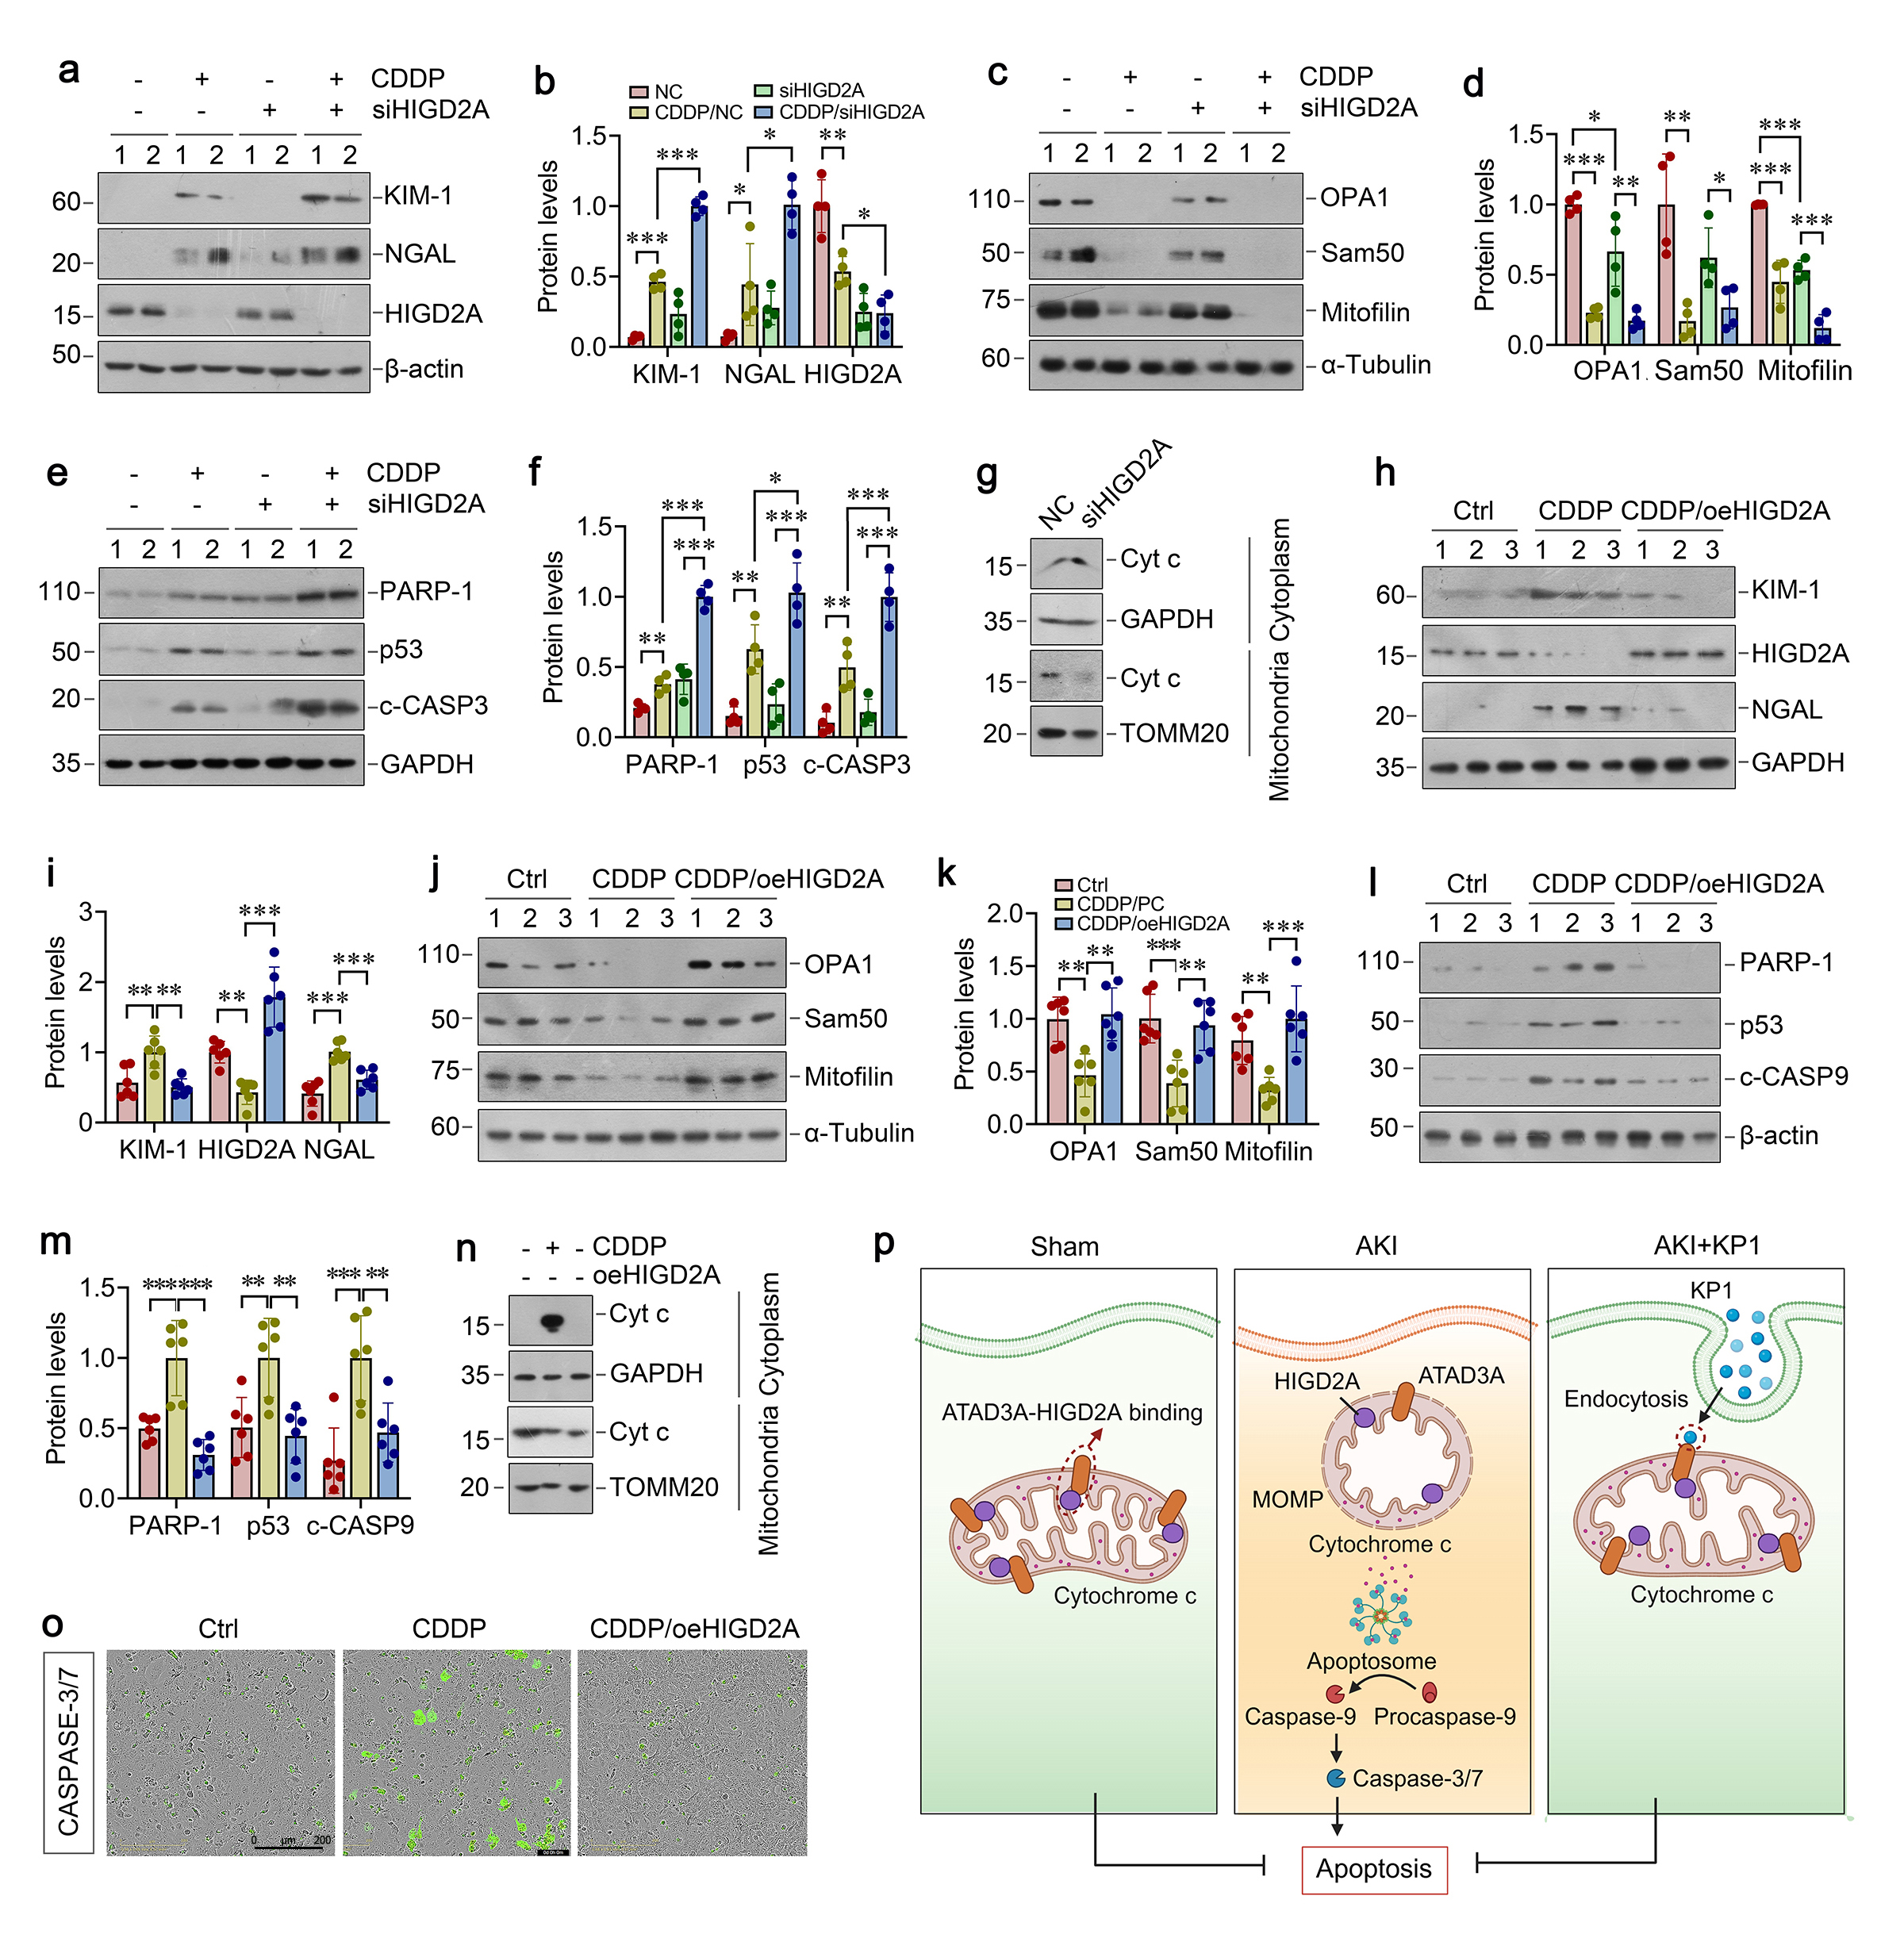
To confirm the role of HIGD2A in protecting against tubular cell apoptosis, we manipulated the expression of HIGD2A by knocking down or overexpression in HKC-8 cells in vitro.  As shown in Figure 8a and b, knockdown of HIGD2A by siRNA aggravated CDDP-induced Kim-1 and NGAL expression in HKC-8 cells.  HIGD2A depletion also worsened the loss of mitochondrial proteins OPA1, Sam50 and mitofilin induced by CDDP (Figure 7c and d).  As a result, HIGD2A knockdown also aggravated PARP-1, p53, and cleaved caspase-3 expression induced by CDDP (Figure 8e-f), suggesting that HIGD2A deficiency further exacerbated tubular cell injury and apoptosis.  Mitochondrial/cytosolic fractionation assays revealed that HIGD2A depletion promoted mitochondrial cytochrome c release into cytosol (Figure 8g).

We further investigated the role of HIGD2A in protecting against tubular cell apoptosis by overexpression.  As shown in Figure 8h-m, overexpression of HIGD2A abolished the induction of Kim-1, NGAL PARP-1 p53 and cleaved caspase-9 and restored mitochondrial proteins OPA1, Sam50 and mitofilin in CDDP-treated HKC-8 cells, suggesting that HIGD2A protects against tubular injury, apoptosis, and mitochondrial dysfunction.  Moreover, HIGD2A blocked CDDP-triggered cytochrome c release from mitochondria to cytosol (Fig. 8n), thereby leading to inhibition of downstream caspase-3 and -7 activation (Fig. 8o).  Taken together, these results suggest that KP1 binds to mitochondrial protein ATAD3A, stabilizes ATAD3A/HIGD2A protein complex and prevents cytochrome c release from mitochondria to cytosol, thereby protecting tubular cells against apoptosis after injury (Figure 8p).

Kidney tubular epithelial cells rely on mitochondria for energy, so preserving mitochondrial integrity is critical for renal health. Here, we show KP1—a Klotho-derived peptide with reno-protective potential—enters tubular cells via endocytosis, directly binds mitochondrial protein ATAD3A to prevent its degradation, and sustains downstream HIGD2A. This blocks cytochrome c release and caspase activation, inhibiting tubular apoptosis and protecting against AKI (Figure 8p), elucidating AKI-related mitochondrial dysfunction mechanisms and supporting KP1 as a therapeutic candidate for AKI.​

A key novel finding is KP1 mimics full-length Klotho’s AKI protection (Figure 1) independently of canonical TGF-β/Smad signaling, indicating a new mode of action. Evidence confirms this: FITC-KP1 enters HKC-8 cells, and endocytosis blockade abolishes its protection (Figure 3); molecular docking, co-IP, MST, and DARTS show KP1 binds ATAD3A with high affinity, preserving it post-injury (Figure 4); ATAD3A overexpression/knockdown inhibits/accelerates CDDP/IRI-induced tubular injury (Figures 5–6). Label-free imaging reveals KP1 does not prevent initial CDDP-induced mitochondrial damage but restores integrity within 36 h (Figure 2), with similar results in H/R, showing KP1 reverses established mitochondrial injury.

​Klotho alleviates renal mitochondrial dysfunction via multiple indirect pathways, but how extracellular Klotho modulates mitochondria remains unclear (presumed receptor-mediated). Our study is the first to show the KP1 directly enters cells to engage mitochondrial proteins, challenging existing Klotho paradigms. Whether membranous/soluble Klotho uses endocytosis to bind mitochondrial proteins requires further study.​ ATAD3A, a key mitochondrial regulator (maintaining cristae, mtDNA nucleoids, and mediating processes like mitophagy and respiration), is a promising therapeutic target, but no targeting agents existed—our identification of KP1 as an ATAD3A stabilizer fills this gap, extending its potential beyond AKI to other mitochondrial pathologies.​ We also identify HIGD2A as a novel ATAD3A partner. HIGD2A is highly expressed in healthy tubular epithelium, downregulated in AKI, and restored by KP1. It interacts with ATAD3A (Figure 7), and HIGD2A overexpression/knockdown attenuates/aggravates AKI-induced apoptosis (Figure 8).​

In summary, KP1 protects against AKI by entering tubular cells, binding ATAD3A, and stabilizing the ATAD3A-HIGD2A complex, blocking cytochrome c release and caspase activation. This establishes KP1 as the first direct mitochondrial-targeting therapy, supporting its use for AKI and other mitochondrial diseases.

Kewords