EXPENDITURE OF THE BRAZILIAN PUBLIC HEALTH SYSTEM (SUS) ON TOTAL NEPHRECTOMY: WHAT HAS CHANGED WITH THE PANDEMIC?

https://storage.unitedwebnetwork.com/files/1099/5fa2ba59248e6b52dbc191a4a1fd3361.pdf
EXPENDITURE OF THE BRAZILIAN PUBLIC HEALTH SYSTEM (SUS) ON TOTAL NEPHRECTOMY: WHAT HAS CHANGED WITH THE PANDEMIC?
Geraldo
Bezerra da Silva Junior
Pedro Ribeiro pedroviannago2019@gmail.com UNIFOR School of Medicine Fortaleza
João Filipe Furtado joaofilipecavalcante@gmail.com UNIFOR School of Medicine Fortaleza
Felipe Dias felipecavalcantidiascd@gmail.com UNIFOR School of Medicine Fortaleza
Lívia Maria Barroso liviamouraob@gmail.com UNIFOR School of Medicine Fortaleza
Emanuella Silveira emanuellaosilveira@gmail.com UNIFOR School of Medicine Fortaleza
Maria Rita Nogueira mariaritatn28@gmail.com UNIFOR School of Medicine Fortaleza
Maria Landim mariaarraislandim@gmail.com UNIFOR School of Medicine Fortaleza
Carlos Eduardo Vasconcelos santiago.cadu01@edu.unifor.br UNIFOR School of Medicine Fortaleza
Anne Rafaelle Linhares annemoreno@edu.unifor.br UNFIOR School of Medicine Fortaleza


Total nephrectomy (TN) is a surgical procedure intended for patients with conditions that necessitate kidney removal, but its cost is high and can strain the family budget. The Unified Health System (SUS) is responsible for ensuring universal access to healthcare in Brazil, including total nephrectomy. In this regard, it is important to understand SUS expenditures on this type of procedure to evaluate the allocation of public resources in the healthcare sector and promote the improvement of the quality of life of patients who require complete kidney removal.

This is a quantitative descriptive study on SUS expenditures for total nephrectomy and the impact of the COVID-19 pandemic on its investment, based on data obtained from DATASUS from 2017 to December 2022. Approximate values ​​were used, in American dollars (U$), in the quotation at the time, using an average of values ​​adopted, in the pre-pandemic period, from January 2017 to December 2019 and, in the post-pandemic period, from January 2020 to December 2022, due to the floating exchange rate.

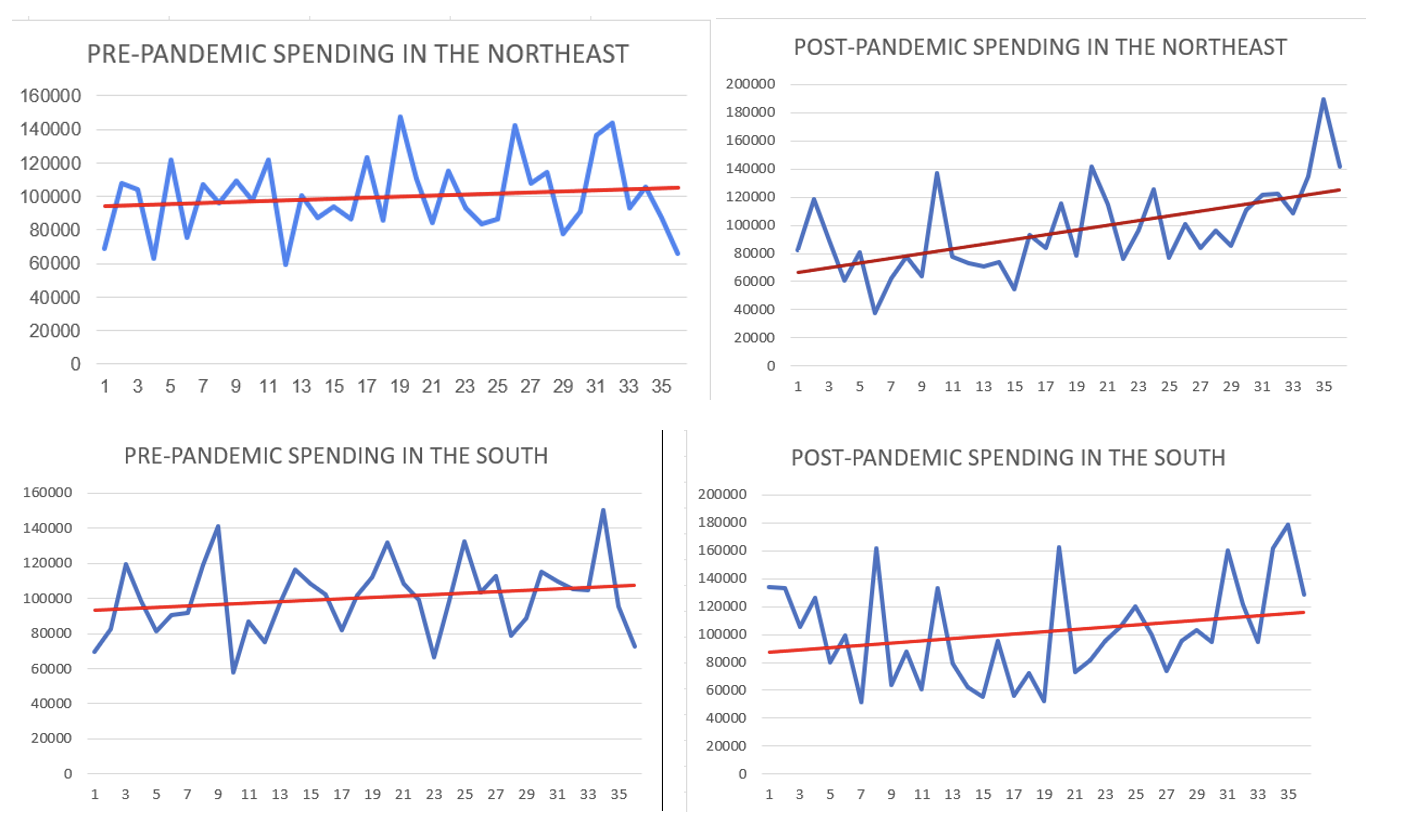
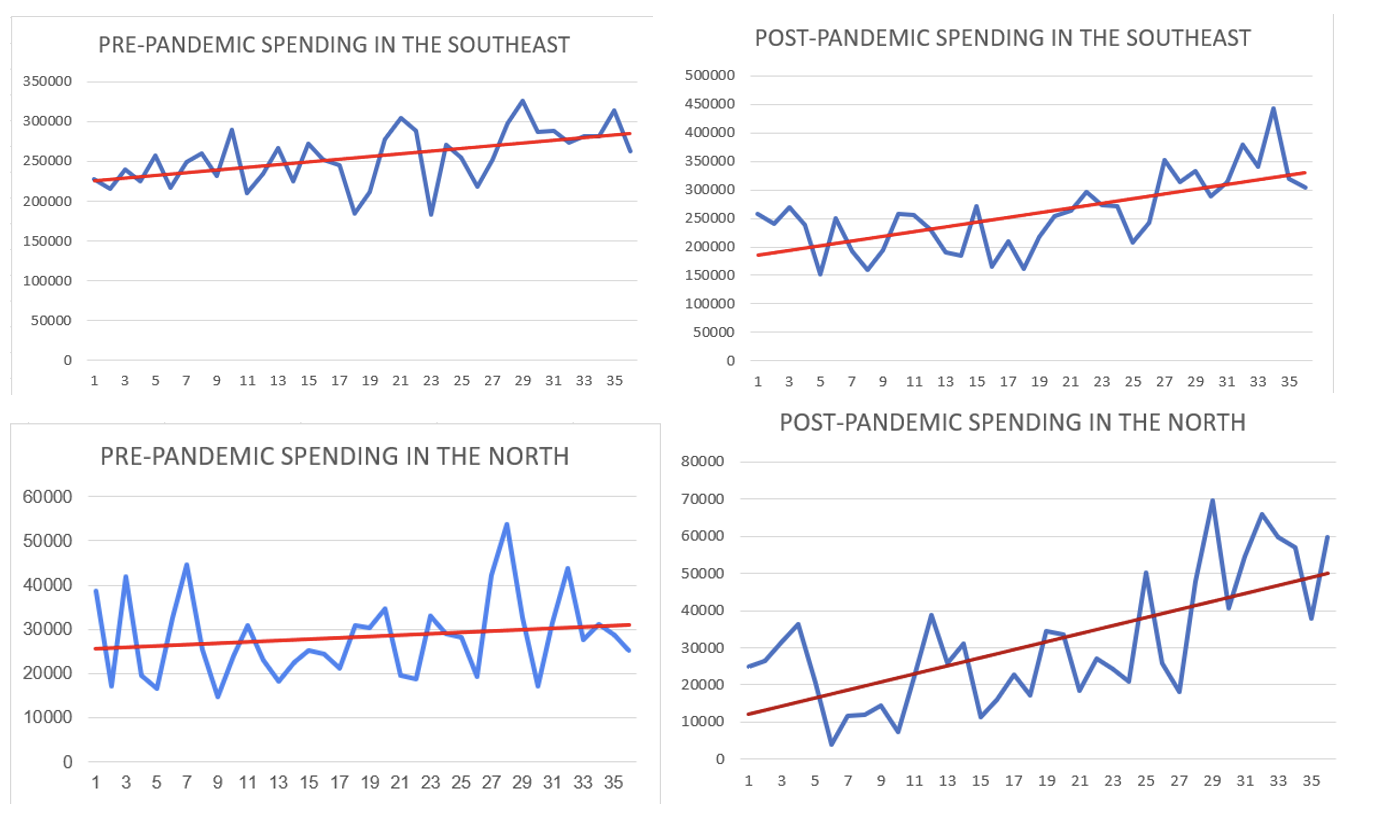
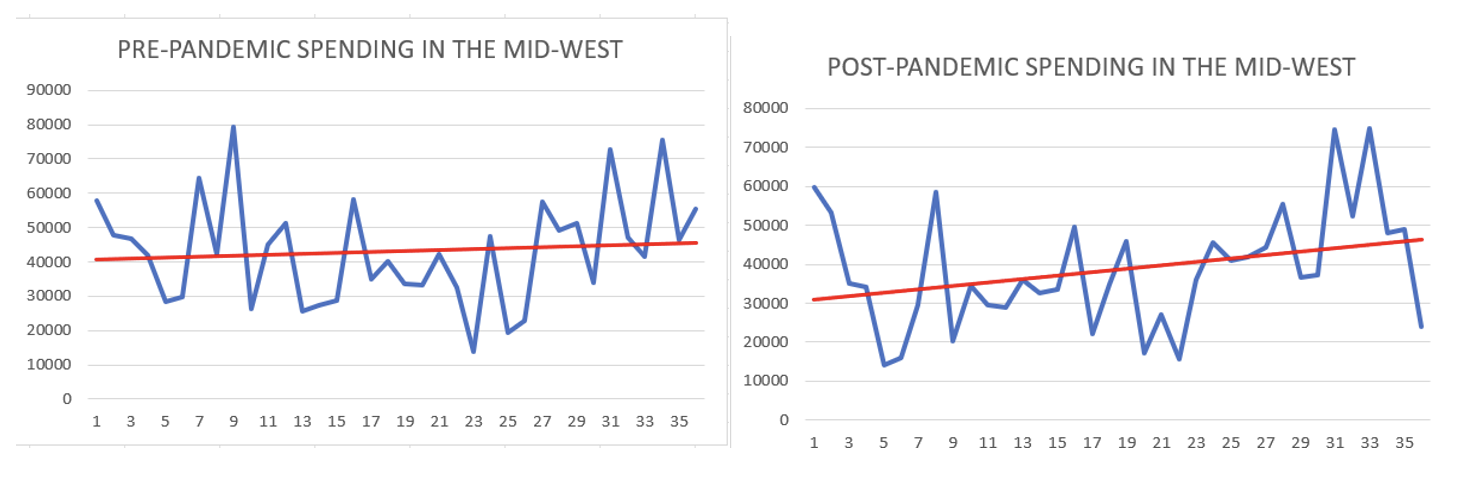
Pre-Pandemic Period (2017-2019): Northern Region: Peak in spending (PIS) in 04/2019 was U$14,841.60, totaling U$2,929.123.12, with an average of U$7,792.18, a Standard Deviation (SD) of U$2,535.70, and an Increasing Trend Line (ITL). Northeastern Region: PIS in 07/2018 was U$40,659.62, totaling U$991,218, with an average of U$27,533.84, a SD of U$6,162.22, and ITL. Southeast Region: PIS in 05/2019 was U$90,040,28, totaling U$2,528.80, with an average of U$70,321.11, a SD of U$9,644.71, and ITL. South Region: PIS in 10/2019 was U$41,501.81, totaling U$995,113.04, with an average of U$27,642.02, a SD of U$5,770.93, and ITL. Mid-West Region: PIS in 09/2017 was U$21,910.64, totaling U$427,950.50, with an average of U$11,997.79, a SD of U$4,301.50, and ITL. Post-Pandemic Period (2020-2022): Northern Region: PIS in 05/2022 was U$15,061.07, with a total of U$242,003.24, an average of U$6,722.31, a SD of U$3,730.74, and ITL. Northeastern Region: PIS in 11/2022 was U$40,984.06, with a total of U$747,770.81, an average of U$20,771.40, a SD of U$6,623.02, and ITL. Southeast Region: PIS in 10/2022 was U$95,920.90, with a total of U$2,010,219.03, an average of U$22,839.41, a SD of U$14,171.78, and ITL. South Region: PIS in 11/2022 was U$38,698.46, with a total of U$791,695.56, an average of U$21,834.68, a SD of U$7,632.66, and ITL. Mid-West Region: PIS in 09/2022 was U$16,184.50, with a total of U$300,432, an average of U$8,345.33, a SD of U$3,277.33, and ITL. 


It can be concluded that the impact of the pandemic on TN expenditures was greater in the Northern Region, with a 10.08% increase compared to pre-pandemic values. In the Southeast, despite being the region with the highest expenditures, the increase was only 1.43% compared to the pre-pandemic period. Meanwhile, there was a 3.74% reduction in expenditures in the Northeast and a 10.43% reduction in the Central-West region. These differences can be attributed to the different government strategies in each region, as well as the varying healthcare demands of the population. Investigations of this kind require further emphasis given their importance in better understanding the impacts of the pandemic in the context of national healthcare.

E-Poster Format Requirements
  • PDF file
  • Layout: Portrait (vertical orientation)
  • One page only (Dim A4: 210 x 297mm or PPT)
  • E-Poster can be prepared in PowerPoint (one (1) PowerPoint slide) but must be saved and submitted as PDF file.
  • File Size: Maximum file size is 2 Megabytes (2 MB)
  • No hyperlinks, animated images, animations, and slide transitions
  • Language: English
  • Include your abstract number
  • E-posters can include QR codes, tables and photos